
Announcement
This page is also available in Deutsch, Español, Français, Italiano, 日本語, and Português.
Trend detection that surfaces what actually matters
Improved "what's trending analysis", designed for people and agents alike.
Cloud cost trend analysis is only useful if you trust it. That gap is closed. Trend detection in Cloud Intelligence™ reports has been rebuilt from the ground up, and it now tells three stories apart: costs that are steadily growing or shrinking, costs that changed once and settled (a decommission, a migration, a pricing change), and costs that are brand new and still climbing.
What you get
The trend detector keeps the same controls you already use. Trending up, Trending down, and Not trending are still there in the report's Advanced analysis options, in the Trending services preset, and in the advancedAnalysis fields of the Reports API and the dci CLI.
What changes is what qualifies. A flag now has to pass three tests at once: the trend is statistically real (a Mann-Kendall significance test, now seasonality-aware for daily and hourly views), the rate of change is material (at least a few percent of the item's spend level per period), and the item is worth your attention relative to the report you're looking at.
New costs get their own treatment. A line item that appears mid-window and keeps spending is flagged as trending up from its first sustained months, instead of being skipped for not having enough history. And a one-time step change no longer masquerades as an ongoing trend, because "this already happened" and "this is still happening" call for different responses.
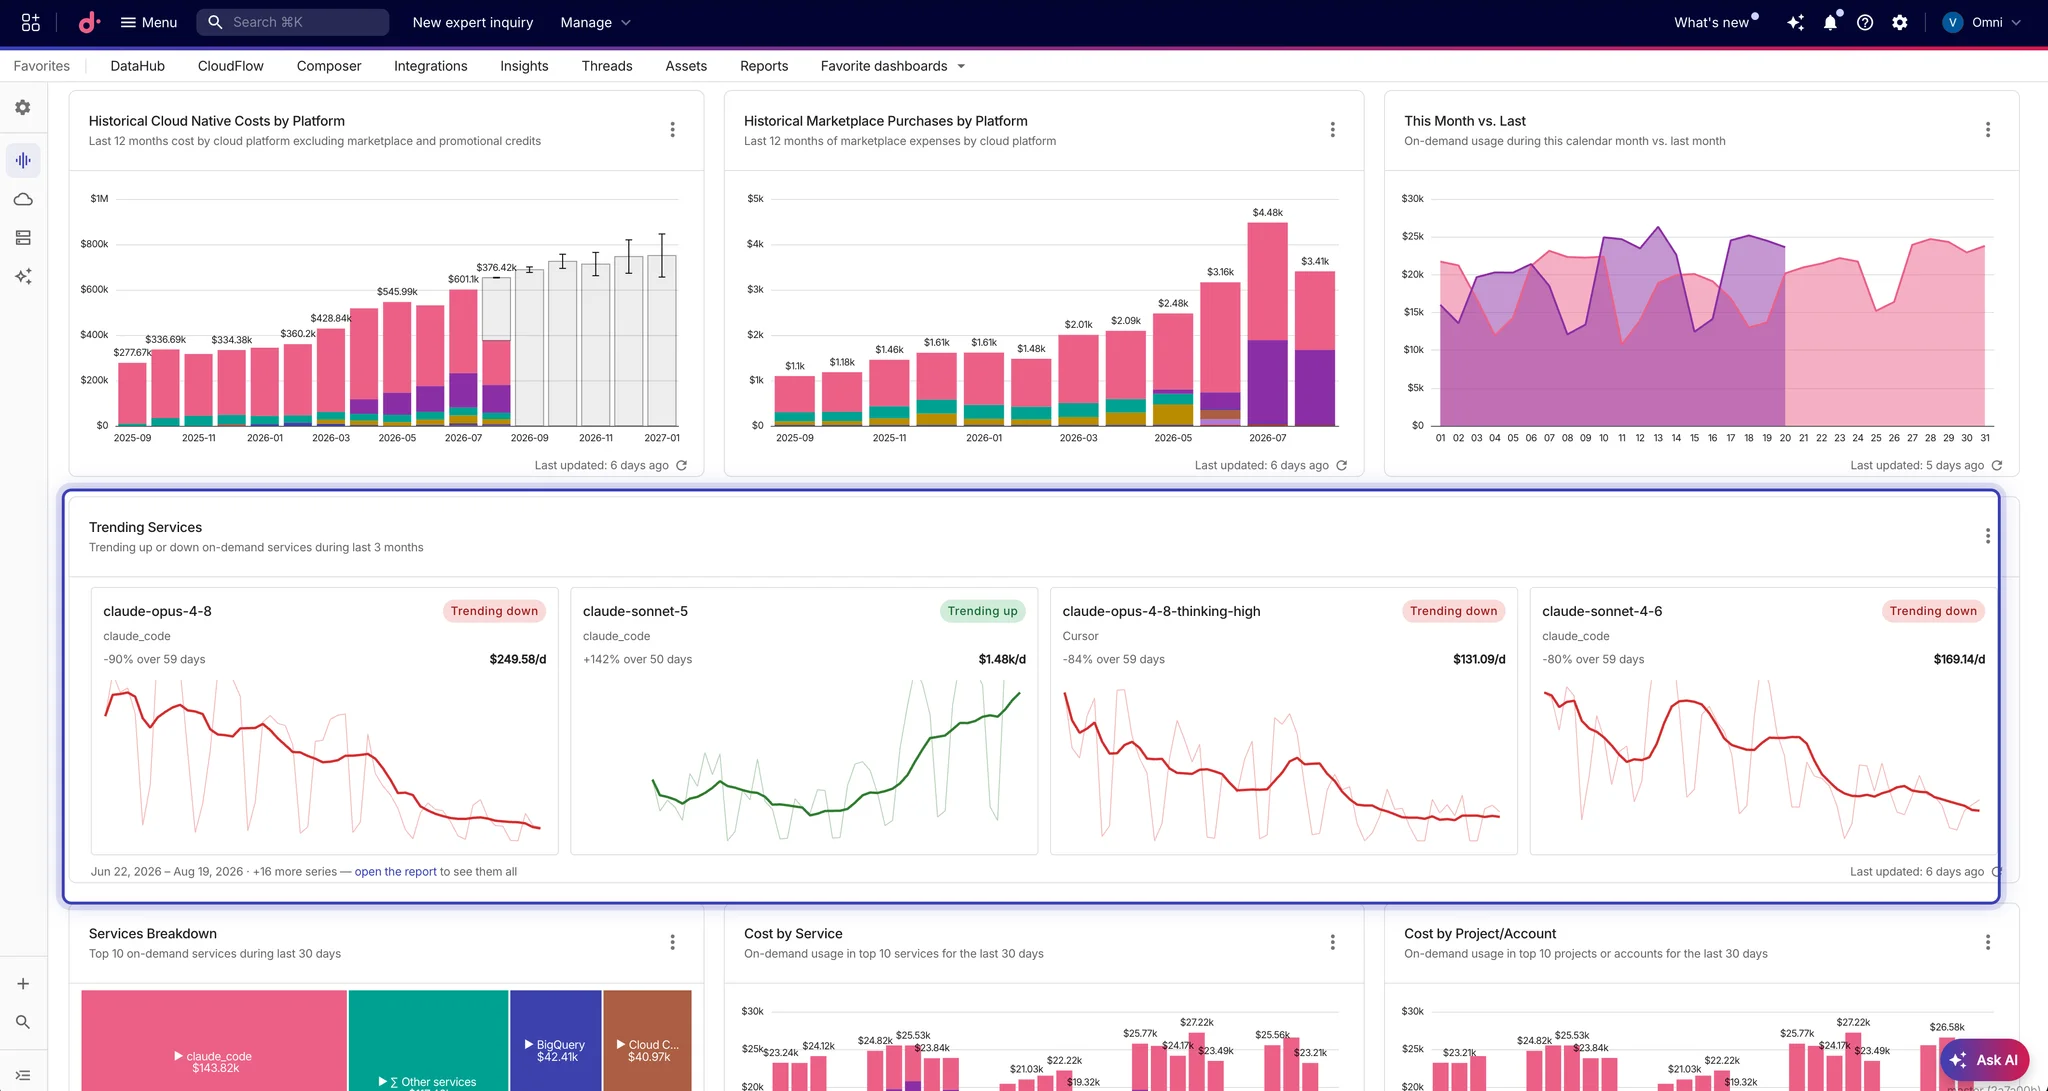
We ran the new detector side by side with the old one on our own six-month bill before shipping it. Across 3,584 SKU-level line items, flags dropped from 398 to 123, and not one of the survivors flipped direction.
The median flagged item went from $10.54 a month of spend to $206, a 20x jump in economic relevance. The other side of the ledger is what the old detector missed: about $143K a month of newly appearing costs carried no trending signal at all, including our fastest-growing line item, which went from $49K to $127K a month in four months without ever being flagged.
Get started
- Open any time-series report and pick Trending up or Trending down under Advanced analysis.
- Check the Trending services preset on your Pulse dashboard for the ready-made view.
- Query the same flags programmatically with
advancedAnalysisin the Reports API or the dci CLI.
