





Setup
One API token. Full Grafana Cloud visibility.
Connect your Grafana Cloud organization with a read-only access policy token. DoiT pulls usage and billing data for metrics, logs, and traces automatically. No agents, no collector changes, no custom dashboards to maintain. Unified reports are ready within hours of connecting.
What you get
Built for the realities of running Grafana Cloud
The things FinOps and platform leaders actually ask us for when they connect their Grafana Cloud stacks.
Unified usage reporting
Slice Grafana Cloud spend by stack, team, or signal type (metrics, logs, and traces) without building custom pipelines.
Ingestion anomalies
Catch sudden spikes in log volume or active series in minutes.
High-cardinality insights
Surface the labels and metrics driving your active series bill.
Retention optimization
Spot logs and metrics held longer than teams actually query.
Signal-level cost breakdown
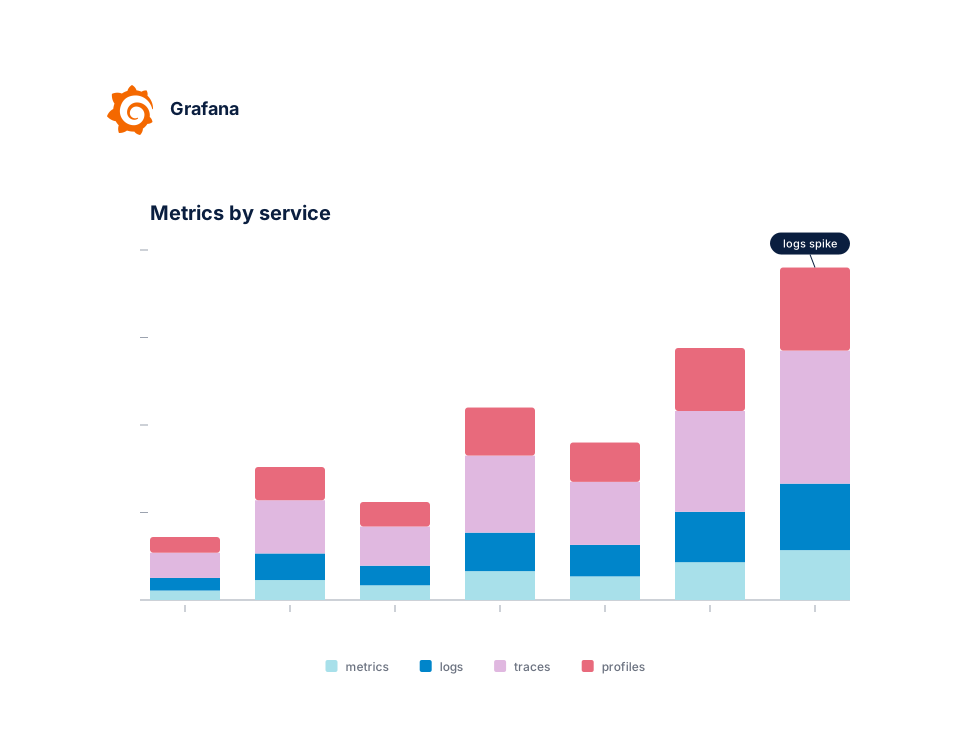
See exactly how metrics, logs, traces, and profiles each contribute to your monthly invoice, by stack and team.
Budgets and alerts
Set budgets per stack or team and alert before overages hit.
Grafana's usage views tell you what you consumed. Cloud Intelligence™ helps you do something about it.
Beyond Grafana Cloud's usage tab
Multi-stack rollups
Consolidated views across every Grafana Cloud stack in your org, with drilldown into any team or signal type.
Real-time anomaly alerts
Machine-learning detection on ingestion, active series, and query volume, routed to Slack or email.
Cardinality planning
Model the cost impact of new labels and scrape targets before they blow up your active series count.
Team and label allocation
Attribute observability spend to the teams generating it, and split shared costs the way finance expects.
Kubernetes-aware attribution
Break down Grafana Cloud usage by cluster, namespace, and workload alongside your underlying infra spend.
Forward Deployed Engineers
World-class cloud architects who work as an extension of your team to implement optimizations.
Fast-growing companies run on Cloud Intelligence™
Avg. savings within first 90 days
Avg implementation time

“DoiT's focus on reliability, mixed with the system's flexibility, helps us safely optimize our Amazon EKS workloads with zero-touch from our engineers.”
Oren Ashkenazy
Director of DevOps and Cloud at Fiverr
Ready to connect your Grafana Cloud stacks?
Put your observability spend on a shorter leash.
Frequently asked
questions
Is there a single view of Grafana Cloud costs across multiple stacks?
Connect your Grafana Cloud organization once. Cloud Intelligence™ ingests usage and billing data for every stack, so you can slice costs by stack, team, or signal type from a single view. No spreadsheets, no manual rollups.
What does connecting Grafana Cloud usage data to Cloud Intelligence™ involve?
Generate a read-only access policy token in Grafana Cloud and add it to DoiT. The platform handles ingestion, normalization, and granular reporting from there. Most teams are live within a day.
Which teams or services account for the bulk of my Grafana Cloud spend?
Cost & Usage reports let you drill from total observability spend down to the stack, team, or label set responsible. Filter by signal type, cluster, or namespace without writing PromQL or LogQL against usage metrics.
Will I be alerted to Grafana Cloud ingestion anomalies as they happen?
Anomaly detection runs continuously across active series, log volume, and trace ingestion. When something looks off, you get a Slack or email alert with the likely cause, long before it shows up on your invoice.
Can I tell which metrics and labels are blowing up my active series count?
Yes. Cloud Intelligence™ surfaces the high-cardinality metrics and labels driving your bill so you can drop, aggregate, or relabel them before the next billing cycle.
I already use Grafana Cloud's built-in Cost Management. What does Cloud Intelligence™ add?
Grafana's usage views are scoped to Grafana Cloud. Cloud Intelligence™ puts observability spend next to your AWS, Google Cloud, and Azure costs, adds anomaly detection, budgets, allocation, and gives you access to forward deployed engineers who help you act on what the data shows.
Does this work with self-hosted Grafana or only Grafana Cloud?
Billing and usage attribution is focused on Grafana Cloud, where the cost signal lives. For self-hosted deployments, we attribute the underlying infrastructure spend (compute, storage, egress) by cluster, namespace, and workload.
What access does Cloud Intelligence™ get to my Grafana Cloud organization, and how is it protected?
Cloud Intelligence™ uses a read-only access policy token scoped to usage and billing APIs. We never change your stacks or dashboards, and the platform is SOC 2 Type II certified.