
Announcement
This page is also available in Deutsch, Español, Français, Italiano, 日本語, and Português.
Cross-period trend charts for daily and weekly budgets
Track per-period spend against your budget across the last 30 days or 16 weeks.
If you run daily or weekly recurring budgets, spotting a spend trend takes work. A single data point per period doesn't show whether costs are drifting up, holding steady, or spiking on certain days. You end up exporting data or building separate reports just to see the pattern.
Daily and weekly budgets in Cloud Intelligence™ now include a cross-period trend chart that plots your actual per-period spend against the budget amount over time.
30-day and 16-week history: View the last 30 periods (daily) or 16 periods (weekly) of actual spend charted against your per-period budget line, so you can spot patterns at a glance.
Partial-period indicator: The current live period is clearly marked as partial, so you won't mistake in-progress spend for a completed period.
One-click toggle: Switch between the new trend view and the original single-period chart whenever you need the focused view.
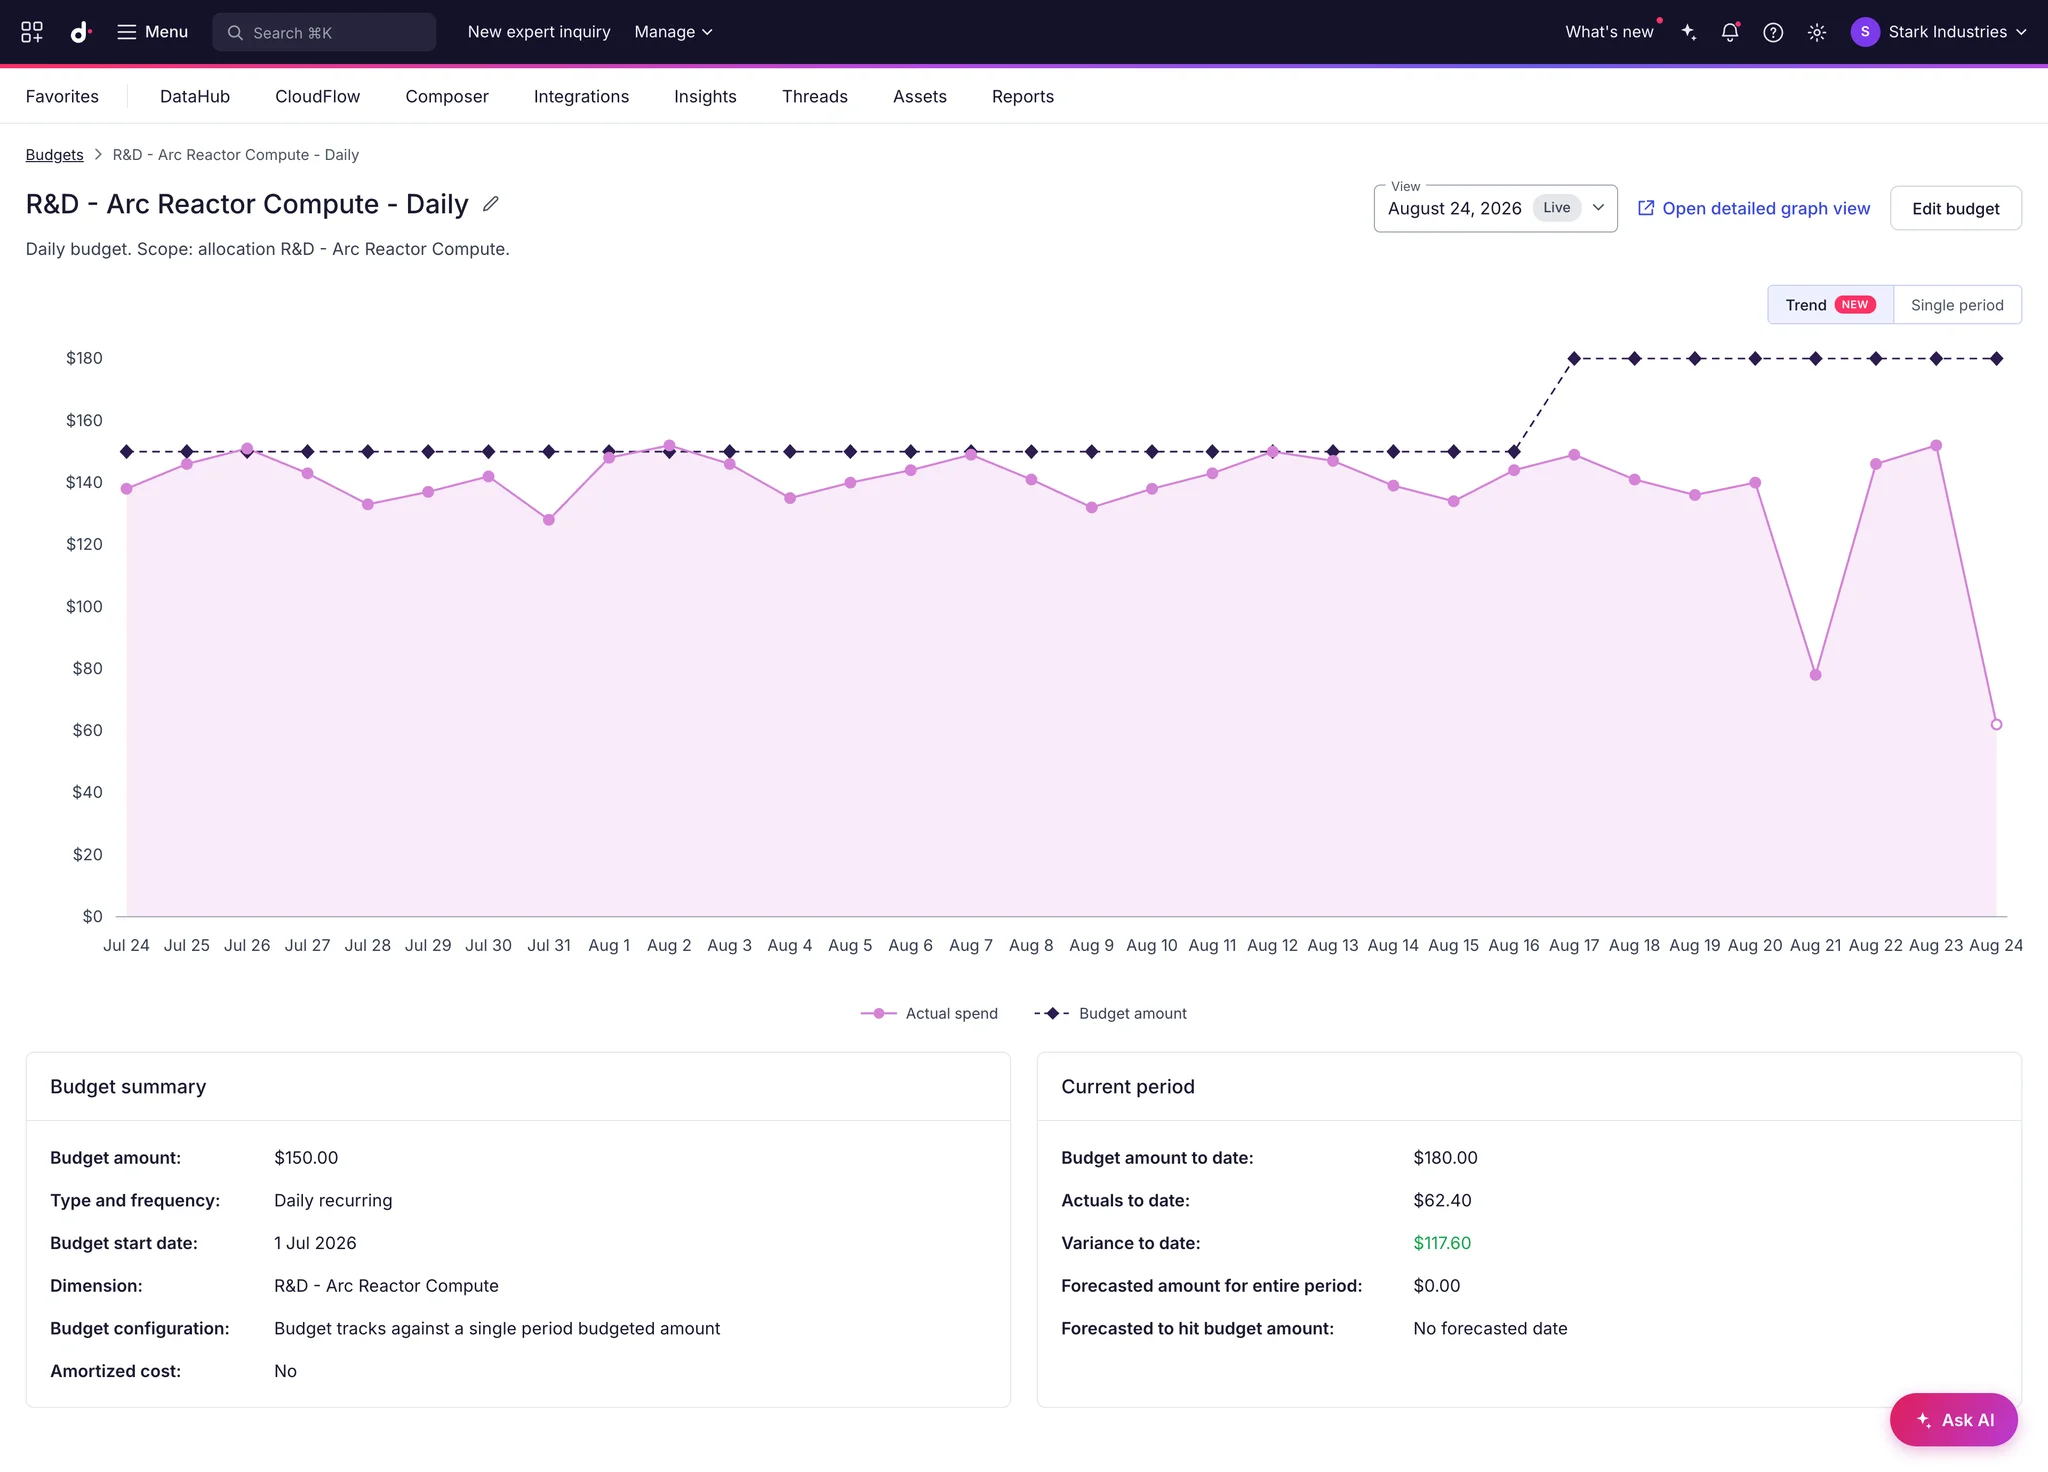
The trend chart is the new default for daily and weekly recurring budgets. No setup required.
To get started, open any daily or weekly budget in the Cloud Intelligence™ to see the trend chart.
Available to customers on all Cloud Intelligence™ tiers.
