
Announcement
This page is also available in Deutsch, Español, Français, Italiano, 日本語, and Português.
Bring Cloud Intelligence™ into Grafana
Live cloud cost data in the dashboards you already run. Available now for all Cloud Intelligence™ customers.
If Grafana is where you watch your infrastructure, you can now answer cost questions without leaving it. "What does this service cost when it's under load?" used to mean bouncing between Grafana and Cloud Intelligence™. Now it's one dashboard.
The new Cloud Intelligence™ datasource plugin puts live cost panels next to your operational graphs. Here's what that gets you:
- Answer cost questions in seconds, not export cycles. Pull Cloud Analytics report data straight into Grafana panels. No CSV exports, no JSON parsing, no UQL.
- See cost and performance in one view. Cost per service next to p99 latency is one panel away. When someone asks why spend jumped Tuesday night, the deploy marker is right there on the same timeline.
- Zero new habits to learn. The plugin respects the Grafana time picker and supports template variables. Your existing dashboards, alerting, and sharing workflows all apply to cost panels too.
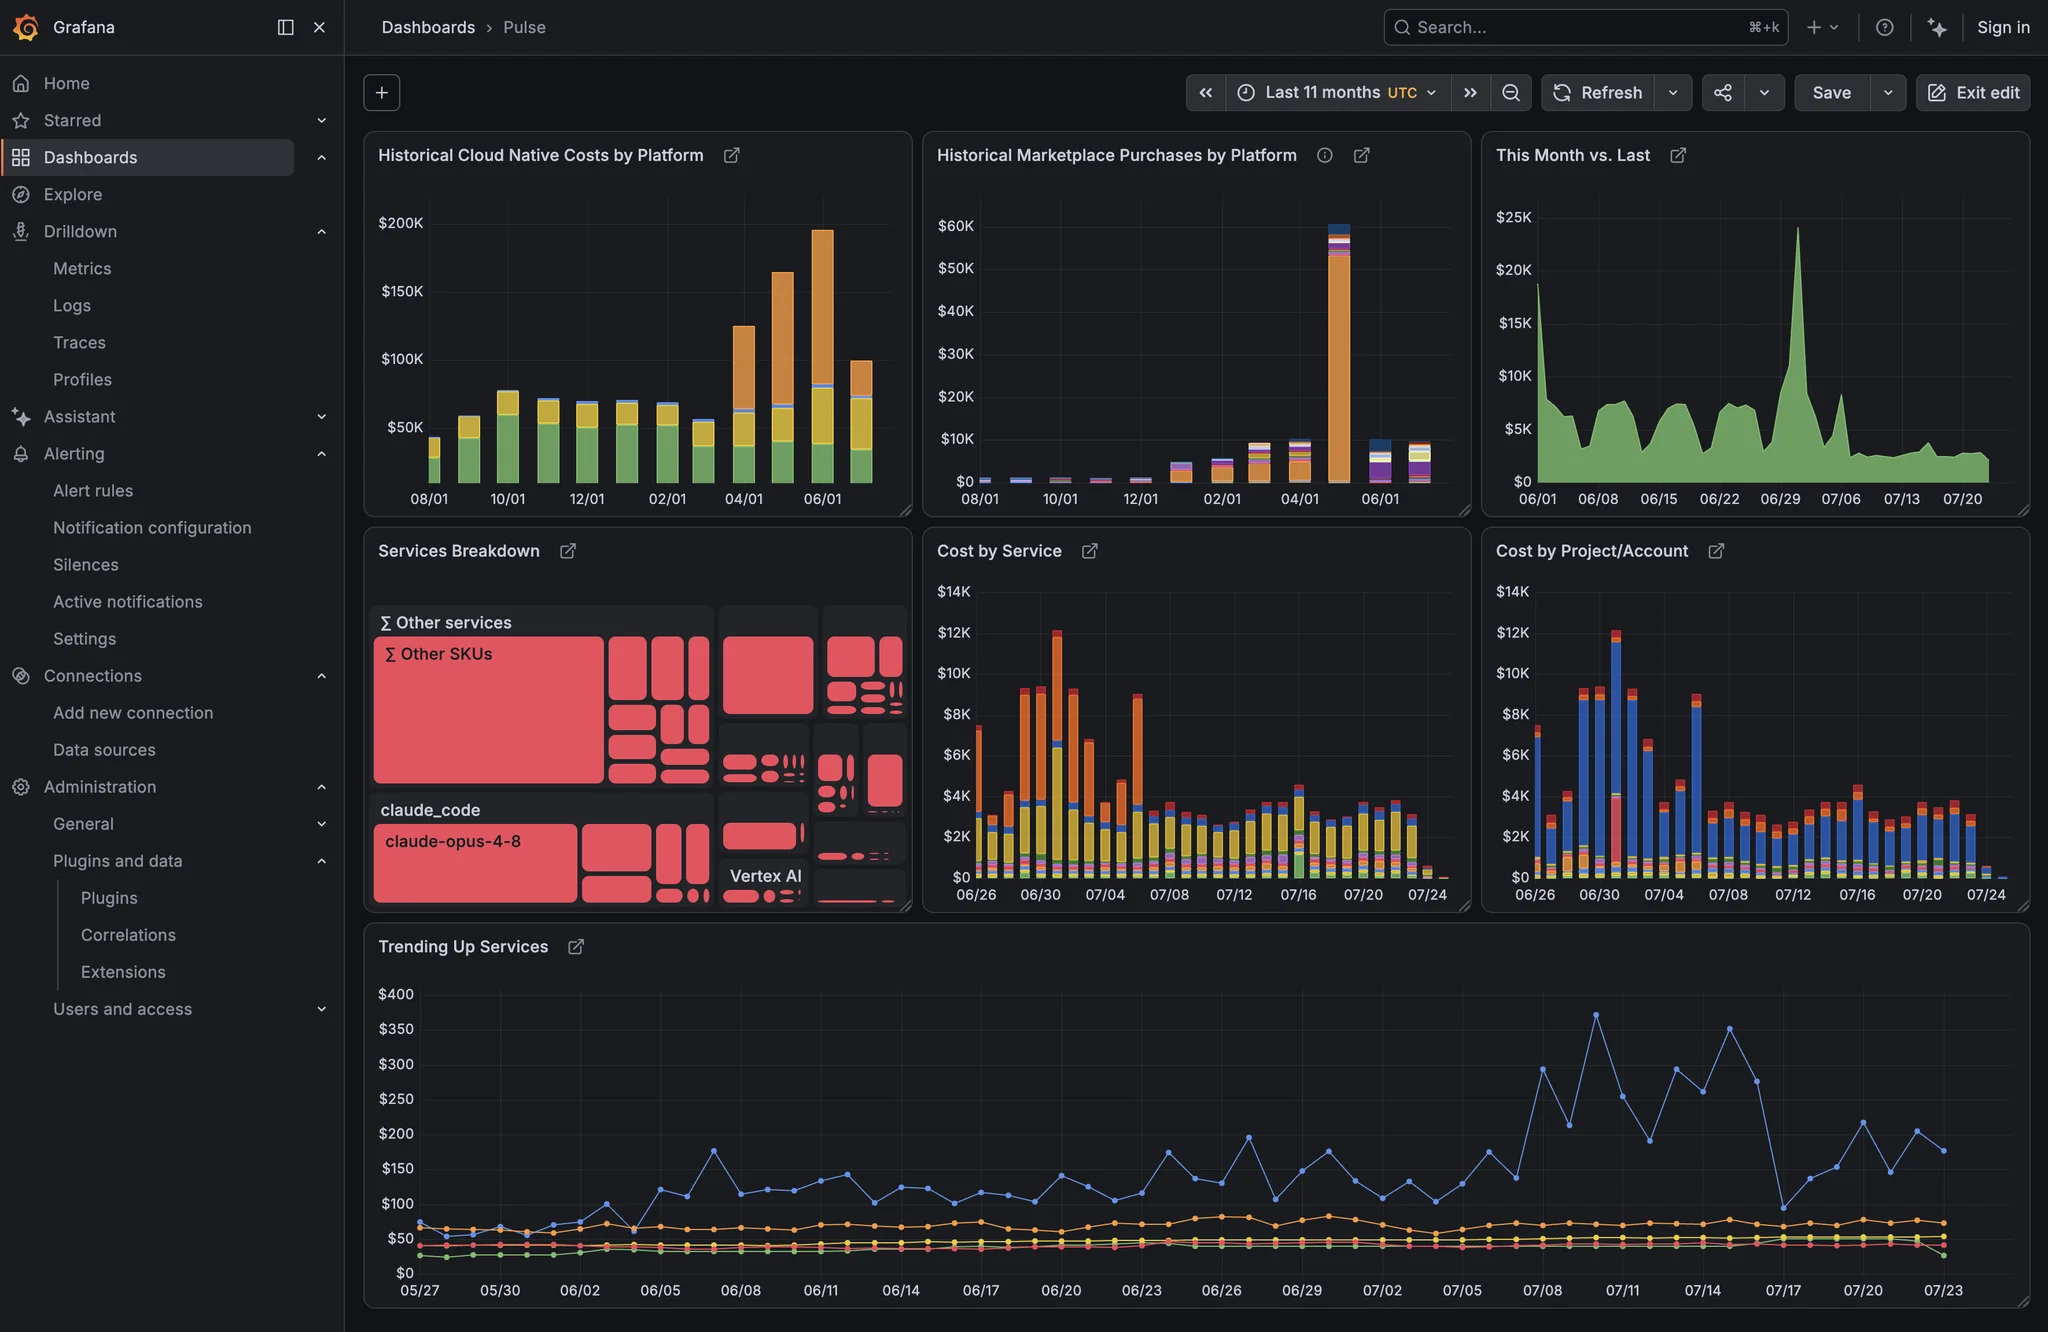
The plugin is available to all Cloud Intelligence™ customers on every tier, at no extra cost.
One thing to know: it's still going through Grafana's review process, so it's not in the plugin catalog yet. Until it lands there, download and install it from GitHub. To help you get started, use this tutorial.
Related documentation
