
In part one we put budgets, allocations, alerts and reports under version control. Since then, the DoiT Terraform provider has shipped five minor releases in about two months (v1.6 through v1.10).
Both the number of organizations using the provider and its API traffic have grown considerably since then. Allocations account for the bulk of that traffic, and every organization that reads its budgets through the provider also uses it to write them, whether that's creating, updating or deleting budgets.
So this post goes in two directions:
- Deeper on the core resources. These are patterns you find after a few months of FinOps as code: generating allocations, budgets and alerts from a single team map, plan-time health checks, and reports that leave the console as PDFs.
- Wider, to the tenant itself. Customer-wide settings, custom roles, user onboarding, and service accounts with rotating tokens. By the end, a weekly FinOps report will run in GitHub Actions without anyone's personal API key.
The provider now covers 20 resources and 85 data sources. Every snippet below was tested against a real DoiT tenant before it went into this post (applied, re-planned for drift and destroyed wherever that's safe), and most of them are also in the provider documentation examples.
Upgrading from an Earlier v1.x Release
If you set things up after the first post, you're probably on v1.5 or earlier. Most teams upgrade quickly (the large majority of active organizations are already on v1.6 or later), and the upgrade itself is usually smooth. A few deprecated attributes were removed along the way, though, and these are the ones you might trip over:
| Version | Change | What to do |
|---|---|---|
| v1.7 | max_results on list data sources is a number |
Remove quotes: max_results = 50 |
| v1.8 | doit_budget.scope removed |
Use scopes: one filter whose values list holds every allocation ID |
| v1.8 | doit_alert.config.attributions removed |
Use config.scopes |
| v1.8 | doit_report.config.metric removed |
Use config.metrics (up to four) |
| v1.8 | doit_allocation component inverse_selection removed |
Use inverse |
| v1.8 | Report layouts csv_export / sheets_export removed |
Pick a visualization layout, such as table |
| v1.8 | request_timeout must be above 120s (default 150s) |
Raise or remove custom values |
| v1.8 | Insights resources and data sources removed | The upstream Insights API was deprecated |
| v1.10 | limit_by_change operators use short codes |
gt, gte, lt, lte, b, nb instead of >, >=, … |
| v1.10 | doit_user.job_function removed |
Use job_title |
The deprecated attribute removal guide has migration details for each removal.
Since v1.8, you also get some hardening for free. Reports run through the asynchronous execution API, where the provider submits, polls and fetches the result for you. Rate-limited requests back off properly, and slow requests surface the API's own error instead of timing out locally first.
Advanced Patterns for the Core FinOps Resources
Allocations, budgets, alerts and reports are the four core resources from part one, and they account for most of the provider's API traffic.
Allocations at Scale: One Map, Every Team
If your configuration has an allocation, a budget and an alert for every team, don't copy and paste them. Define your teams once instead:
locals {  teams = {    payments = { budget = 12000, label = "payments" }    search   = { budget = 8000, label = "search" }    platform = { budget = 20000, label = "platform" }  }}
# One single allocation per team, with anomaly detection switched onresource "doit_allocation" "team" {  for_each = local.teams
  name              = "Team: ${each.key}"  description       = "All costs labeled owner=${each.value.label}"  anomaly_detection = true  rule = {    formula = "A"    components = [{      type   = "label"      key    = "owner"      mode   = "is"      values = [each.value.label]    }]  }}
# The same teams as one group allocation that selects the singles aboveresource "doit_allocation" "by_team" {  name              = "Cost by Team"  description       = "Team allocations combined into one group"  unallocated_costs = "Unowned"  rules = [for team in doit_allocation.team : {    action = "select"    id     = team.id  }]}
anomaly_detection became writable on single allocations in v1.7, so anomaly monitoring lives in your config instead of being a checkbox someone has to remember. The group allocation also selects the team allocations instead of redefining them.
Tip: always build groups from
select. You can also define group rules inline withaction = "create", and the DoiT API creates exactly the same single allocations behind the scenes. But those allocations aren't Terraform resources of their own, so inline rules can't set things likeanomaly_detectionorfolder_id. Separate single allocations plusselectgive you real, managed resources.
Because every team now has a real allocation with anomaly detection, you can ask which teams are generating anomalies and get an AI explanation of the most expensive one:
# All anomalies (no max_results, so every page is fetched), sorted so the# costliest one comes firstdata "doit_anomalies" "by_cost" {  sort_by    = "costOfAnomaly"  sort_order = "desc"}
locals {  # An anomaly can belong to several allocations; count it under each one  anomaly_cost_by_allocation = {    for name, costs in {      for pair in flatten([        for a in data.doit_anomalies.by_cost.anomalies : [          for al in a.allocations : { name = al.name, cost = a.cost_of_anomaly }        ]      ]) : pair.name => pair.cost...    } : name => { anomalies = length(costs), total_cost = sum(costs) }  }}
data "doit_anomaly_explanation" "costliest" {  count = length(data.doit_anomalies.by_cost.anomalies) > 0 ? 1 : 0  id    = data.doit_anomalies.by_cost.anomalies[0].id}
output "costliest_anomaly_explanation" {  value     = one(data.doit_anomaly_explanation.costliest[*].explanation.text)  sensitive = true}
The allocations attribute on anomalies (v1.10) lists every allocation an anomaly belongs to, and doit_anomaly_explanation (v1.8) returns the generated explanation along with the facts behind it. On our test tenant, the top anomaly came back as "likely driven by a spike in Amazon SNS Tier 1 request volume, especially in the US West 2 and US West 1 regions".
Budgets That Follow the Allocations
With the team map in place, budgets are one more for_each. Budgets can notify Slack too, and since v1.8 the provider validates the Slack configuration before apply:
resource "doit_budget" "team" {  for_each = local.teams
  name          = "Team: ${each.key}"  type          = "recurring"  time_interval = "month"  currency      = "USD"  amount        = each.value.budget  start_period  = 1767225600000 # 2026-01-01T00:00:00Z in milliseconds
  alerts = [{ percentage = 80 }, { percentage = 100 }]
  scopes = [{    type   = "allocation_rule"    id     = "allocation_rule"    mode   = "is"    values = [doit_allocation.team[each.key].id]  }]
  collaborators = [{ email = data.doit_current_user.me.email, role = "owner" }]  recipients    = [data.doit_current_user.me.email]  recipients_slack_channels = [{    id          = "C0123456789"    customer_id = "your-customer-id"    workspace   = "your-slack-workspace"  }]}
Adding a team is now a one-line change to local.teams, and the allocation, budget and (next section) alert follow automatically.
Since v1.8, doit_budgets also exposes DoiT's server-side risk classification: a risk_status per budget (onTrack, atRisk or unknown), and you can filter on it. Combine that with a Terraform check block and every terraform plan tells you when a team budget is heading for trouble:
check "team_budgets_on_track" {  data "doit_budgets" "team_at_risk" {    name_contains = "Team: "    filter        = "riskStatus:atRisk"  }
  assert {    condition     = data.doit_budgets.team_at_risk.row_count == 0    error_message = "Budgets at risk: ${join(", ", [for b in data.doit_budgets.team_at_risk.budgets : b.budget_name])}"  }}
Check blocks produce warnings, not errors, so they never block an apply, but whoever reviews the plan sees the problem. For AI-suggested budgets, the doit_budget_suggestions data source (v1.7) lists pending recommendations with their confidence and suggested amount, so a human can review them in a pull request.
Alerts Worth Turning On
In our usage data, alerts are the least-used of the four core resources, and far fewer organizations manage alerts through Terraform than budgets. That's a gap worth closing, because alerts got two of the most practical additions since July.
The classic problem with percentage-change alerts is noise. A service that costs $2 a day jumps to $10 and you get a "+400%" alert for eight dollars. ignore_values_range (v1.9) skips any evaluation where the metric value is inside the bounds, and recipients_slack_channels sends the alert where your team actually looks:
resource "doit_alert" "team_spike" {  for_each = local.teams
  name = "Team ${each.key}: daily cost spike"  config = {    metric        = { type = "basic", value = "cost" }    time_interval = "day"    condition     = "percentage-change"    operator      = "gt"    value         = 30 # percent    currency      = "USD"    ignore_values_range = {      lower_bound = 0      upper_bound = 50 # USD per day    }    # Evaluate each service separately, so one service spiking is enough    evaluate_for_each = "fixed:service_description"    scopes = [{      type   = "label"      id     = "owner"      mode   = "is"      values = [each.value.label]    }]  }  recipients = [data.doit_current_user.me.email]  recipients_slack_channels = [{    id     = "C0123456789"    shared = true  }]}
Note that the bounds are in metric units (here, USD per day), not percent, and they only apply to condition = "percentage-change". A shared Slack channel takes its ID and shared = true; a channel in a connected workspace takes its ID and workspace = "<name>" instead.
Reports: Top Movers, Forecasts and New Visuals
Two report additions from v1.6 stand out.
Top Movers. limit_by_change filters rows by period-over-period change, and limit_aggregation controls how the excluded rows are shown. This report keeps only services whose total cost is above $1,000 and grew by 50% or more:
resource "doit_report" "top_movers" { name = "Top Movers" description = "Services with significant month-over-month growth" config = { metrics = [{ type = "basic", value = "cost" }] aggregation = "total" data_source = "billing" time_interval = "month" dimensions = [{ id = "service_description", type = "fixed" }] time_range = { mode = "last" amount = 3 include_current = true unit = "month" } metric_filter = { metric = { type = "basic", value = "cost" } operator = "gt" values = [1000] operand = "series_total" } limit_by_change = { metric = { type = "basic", value = "cost" } change_type = "percentage" operator = "gte" values = [50] include_incomplete_data = false } limit_aggregation = "top" display_values = "actuals_only" layout = "table" currency = "USD" }}Forecasts and themes. forecast_settings projects future spend from historical data, and the v1.8 layouts (column_and_line_chart, sankey_chart, trend_board and cumulative_comparison) give you more ways to show it. Add display_settings.theme_id and the report uses your brand colors:
resource "doit_custom_theme" "brand" {  name          = "Brand"  primary_color = "#1A73E8"  colors = {    light = ["#1A73E8", "#34A853", "#FBBC04", "#EA4335", "#A142F4", "#24C1E0"]    dark  = ["#8AB4F8", "#81C995", "#FDD663", "#F28B82", "#C58AF9", "#78D9EC"]  }}
resource "doit_report" "forecast" {  name        = "Spend Forecast"  description = "Last 12 months of spend with a 3-month forecast"  config = {    metrics       = [{ type = "basic", value = "cost" }]    aggregation   = "total"    time_interval = "month"    currency      = "USD"    data_source   = "billing"    time_range = {      mode            = "last"      amount          = 12      unit            = "month"      include_current = true    }    dimensions = [      { id = "year", type = "datetime" },      { id = "month", type = "datetime" },    ]    forecast_settings = {      mode                      = "totals"      historical_time_intervals = 12      future_time_intervals     = 3    }    layout          = "column_and_line_chart"    display_values  = "actuals_only"    sort_dimensions = "a_to_z"    display_settings = {      theme_id     = doit_custom_theme.brand.id      number_scale = "thousands"    }  }}
One caveat: forecast values aren't included in report results or exports yet. The theme, on the other hand, carries all the way through, as the next section shows.
Reports Leave the Console: PDF and PNG Export
You can now get a report out of DoiT as a file, without anyone opening the console. Since v1.10, doit_report_result and doit_report_query accept file_output = "pdf" or "png" and return a signed download URL:
data "doit_report_result" "forecast_pdf" {  id          = doit_report.forecast.id  file_output = "pdf"
  lifecycle {    postcondition {      condition     = self.file_output_url != null      error_message = "PDF rendering failed. Try applying again."    }  }}
data "http" "forecast_pdf" {  url = data.doit_report_result.forecast_pdf.file_output_url}
resource "local_sensitive_file" "forecast_pdf" {  filename       = "${path.module}/spend-forecast.pdf"  content_base64 = data.http.forecast_pdf.response_body_base64}
The PDF is a polished, multi-page document with your organization's name in the header, and your custom theme carries over: because the forecast report above sets display_settings.theme_id, the PDF is drawn in your brand colors too.
Swap local_sensitive_file for an aws_s3_object (it takes the same content_base64) and the PDF lands in a bucket instead. Report runs go through DoiT's asynchronous execution API, so heavy reports can take a while: raise the data source's read timeout with timeouts = { read = "30m" } if you need to.
You don't even need a saved report. doit_report_query renders an ad-hoc query just as well, which is great for a chart in a README, a pull request comment or a wiki page:
data "doit_report_query" "top_services_png" { file_output = "png" config = { metrics = [{ type = "basic", value = "cost" }] aggregation = "total" time_interval = "month" currency = "USD" time_range = { mode = "last", amount = 3, unit = "month", include_current = false } dimensions = [ { id = "year", type = "datetime" }, { id = "month", type = "datetime" }, ] # Top 5 services by cost group = [{ id = "service_description" type = "fixed" limit = { value = 5, sort = "desc", metric = { type = "basic", value = "cost" } } }] layout = "stacked_column_chart" sort_dimensions = "a_to_z" }}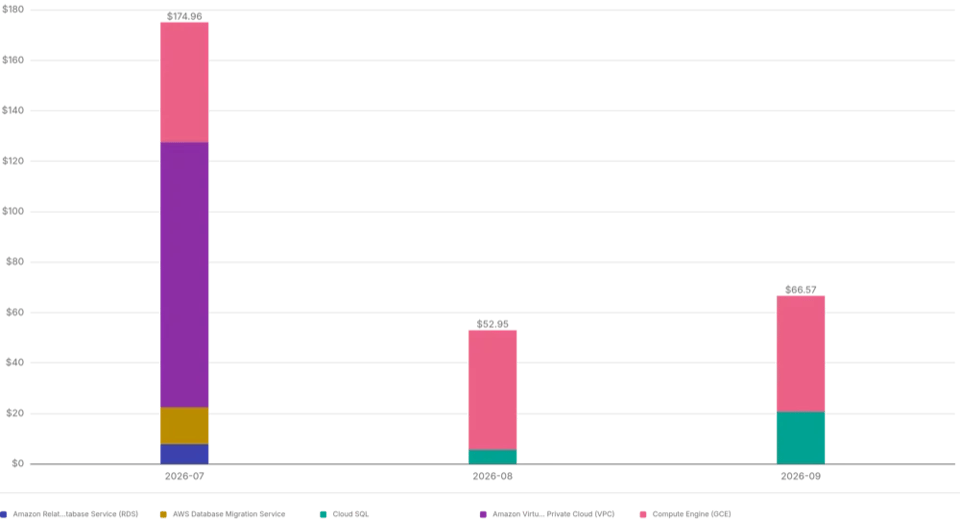
Tip: set
sort_dimensions = "a_to_z"for exports. Without it, the rendered chart orders the time axis by value, so September can end up before August. With it, the months are in calendar order.
The download URL is sensitive and valid for up to seven days. Every plan renders a fresh file, which is exactly what you want for a recurring report. We'll put that to work in the finale.
Your Tenant as Code
Everything so far has been about cost data. But one of the most widely adopted features in the provider is AWS CloudConnect onboarding, through the resource and module from the last post. Teams clearly want their DoiT setup in code, not just their reports, and the last three releases cover the rest of the tenant.
Customer-Wide Settings
doit_customer (v1.8) manages organization-level settings. You don't create a customer, you adopt the one you have, so start with an import:
import {  to = doit_customer.main  id = "your-customer-id"}
resource "doit_customer" "main" {  url_slug = "my-company"
  settings = {    currency               = "USD"    allowed_invite_domains = ["mycompany.com"]    mfa_required           = true  }
  contact = {    emails = ["finops@mycompany.com"]  }}
Your first plan shows exactly how today's settings differ from what you wrote, which is a useful audit on its own. After that, turning off MFA or allowing a new invite domain is a pull request someone has to approve, not a toggle someone can flip.
Custom Roles and Users
doit_role (v1.10) manages custom roles. Permission IDs are opaque, so don't type them: derive them from the preset roles. This role combines two presets into one:
data "doit_roles" "all" {}
locals {  preset_permissions = {    for r in data.doit_roles.all.roles : r.name => r.permissions if r.type == "preset"  }}
resource "doit_role" "finops_analyst" {  name        = "FinOps Analyst"  description = "View Only plus everything a Finance User can see"  permissions = sort(distinct(concat(    local.preset_permissions["View Only"],    local.preset_permissions["Finance User"],  )))}
Onboarding is then a map, just like the teams earlier:
locals {  analysts = {    "ana@mycompany.com"  = { first_name = "Ana", last_name = "Lopez" }    "ravi@mycompany.com" = { first_name = "Ravi", last_name = "Patel" }  }}
resource "doit_user" "analyst" {  for_each = local.analysts
  email      = each.key  first_name = each.value.first_name  last_name  = each.value.last_name  job_title  = "Finance / Accounting"  role_id    = doit_role.finops_analyst.id}
Configurations like this need an identity with enough rights to manage users. Since v1.9, doit_current_user exposes the caller's effective permissions, so you can fail early with a readable message instead of a 403 halfway through an apply:
data "doit_current_user" "me" { lifecycle { postcondition { condition = alltrue([for p in ["UsersManager", "ServiceAccountManager"] : contains(self.permissions, p)]) error_message = "The identity running Terraform needs the UsersManager and ServiceAccountManager permissions." } }}Service Accounts and Rotating Tokens
Service accounts are the headline feature of v1.10. Pipelines that talk to the DoiT API often run on somebody's personal API key, with all of that person's permissions. A service account gives automation its own identity with only the permissions it needs, and doit_service_account and doit_service_account_token manage both the account and its tokens in Terraform.
Drive the token's name and expiry from a time_rotating resource and Terraform mints a fresh token whenever the rotation date has passed:
resource "doit_service_account" "ci" {  name        = "ci-pipeline"  description = "Runs Terraform from CI"  permissions = ["cloudAnalyticsUser", "budgetsReadOnly"]}
resource "time_rotating" "ci_token" {  rotation_days = 90}
resource "doit_service_account_token" "ci" {  service_account_id = doit_service_account.ci.id  name               = "ci-${formatdate("YYYYMMDD-hhmmss", time_rotating.ci_token.rfc3339)}"  expires_time       = timeadd(time_rotating.ci_token.rotation_rfc3339, "168h")
  lifecycle {    create_before_destroy = true  }}
Four details make this work:
- Changing
nameorexpires_timereplaces the token, so the rotation timestamp in the name is what triggers a new token. It also keeps names unique, which they must be while the old and new token briefly exist side by side. create_before_destroymeans the new token exists before the old one is deleted. We forced a rotation while testing: Terraform created the new token, deleted the old one, and the next plan was clean.- The expiry is a week past the rotation date, so the token keeps working even if nobody runs the next apply on time.
access_tokenis returned only once, at creation. It's marked sensitive. Hand it to wherever it's needed in the same apply.
The token is a normal API token. Set it as DOIT_API_TOKEN and the provider (or any other DoiT API client) authenticates as the service account and sees only the permissions you gave it.
Tip: service accounts can't outrank their creator. Requesting permissions the caller doesn't hold fails with a 403. Also note the naming: service account permissions use camelCase (
cloudAnalyticsUser), whiledoit_current_user.permissionsreports them in PascalCase (CloudAnalyticsUser).
Cloud bill shouldn't be a mystery
One platform for AI and Cloud optimization.
Quick Hits
A few more additions that are worth knowing about:
doit_service_quotasshows AWS and GCP quota utilization. Pair it with a check block and every plan warns before you hit a limit:
  check "service_quota_headroom" {    data "doit_service_quotas" "hot" {      min_utilization_percent = 80    }
    assert {      condition     = length(data.doit_service_quotas.hot.items) == 0      error_message = "Quotas at or above 80%: ${join(", ", [for q in data.doit_service_quotas.hot.items : "${q.cloud_provider}/${q.service}/${q.quota} (${q.utilization_percent}%)"])}"    }  }
On our test tenant this fired immediately for an AWS VPC quota at 80%. Note that reading quotas requires the Manage Settings permission.
doit_billing_explainerbreaks an invoice down per payer, including credits, discounts, savings and marketplace charges.doit_widget/doit_widgetsexpose Cloud Analytics dashboard widget data.doit_cloudconnect_supported_featuresshows which features and permissions are active on each connected AWS account.name_containsfilters ondoit_alerts,doit_allocations,doit_budgets,doit_labelsanddoit_reportsmake "find everything that belongs to team X" a one-liner.- PerfectScale for Commitments data sources (
doit_ps4c_*) and thedoit_support_request_tagsresource round out the releases.
Putting It Together: A Weekly FinOps Report With No Human API Key
The last example combines a service account, a rotating token, a check block, a PDF export and Ava, DoiT's AI assistant, into a GitHub Actions pipeline. It runs every Monday and posts a FinOps summary with the full report attached, using two small Terraform configurations:
- Bootstrap, run once by an admin: creates a minimal-permission service account, a rotating token and the report, then hands the token and the report ID to GitHub. This is the service account snippet from above plus the report, with two resources from the GitHub provider at the end:
  resource "github_actions_secret" "doit_api_token" {    repository      = "doit-finops-demo"    secret_name     = "DOIT_API_TOKEN"    plaintext_value = doit_service_account_token.reporting.access_token  }
  resource "github_actions_variable" "report_id" {    repository    = "doit-finops-demo"    variable_name = "DOIT_REPORT_ID"    value         = doit_report.weekly.id  }
Re-running the bootstrap after the rotation date mints a new token and updates the secret in the same apply, so the pipeline never notices.
- Reporting, run by the pipeline: a budget check block, the PDF export from earlier and one question for Ava. It contains no resources except the downloaded file, so it doesn't need remote state:
  data "doit_ava" "summary" {    question = "Summarize report ${var.report_id} in three short bullet points for an engineering audience. Mention the biggest week-over-week change."  }
  output "summary" {    value = <<-EOT      ## Weekly FinOps report
      ${data.doit_ava.summary.answer}
      _The full report is attached to this run as `weekly-cost-report`._    EOT  }
The workflow itself is short:
name: Weekly FinOps report
on:  schedule:    - cron: "0 7 * * 1" # Mondays 07:00 UTC  workflow_dispatch:
jobs:  report:    runs-on: ubuntu-latest    defaults:      run:        working-directory: reporting    env:      DOIT_API_TOKEN: ${{ secrets.DOIT_API_TOKEN }}      TF_VAR_report_id: ${{ vars.DOIT_REPORT_ID }}    steps:      - uses: actions/checkout@v7      - uses: hashicorp/setup-terraform@v4        with:          terraform_wrapper: false      - run: terraform init -input=false      - run: terraform apply -auto-approve -input=false      - run: terraform output -raw summary >> "$GITHUB_STEP_SUMMARY"      - uses: actions/upload-artifact@v7        with:          name: weekly-cost-report          path: reporting/weekly-cost-report.pdf
Here's a real run. The check block flagged an at-risk budget in the log, Ava's summary is on the run page, and the PDF is attached as an artifact:
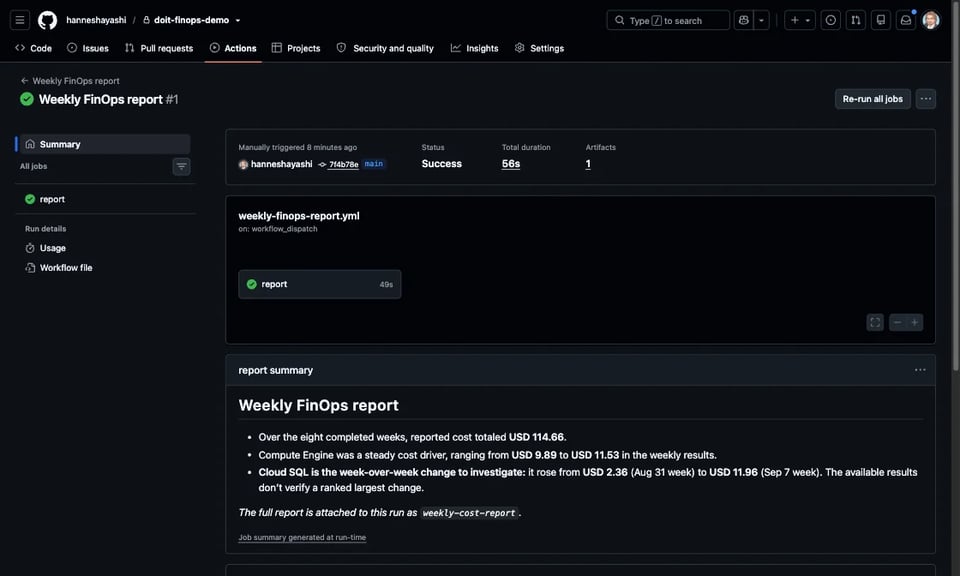
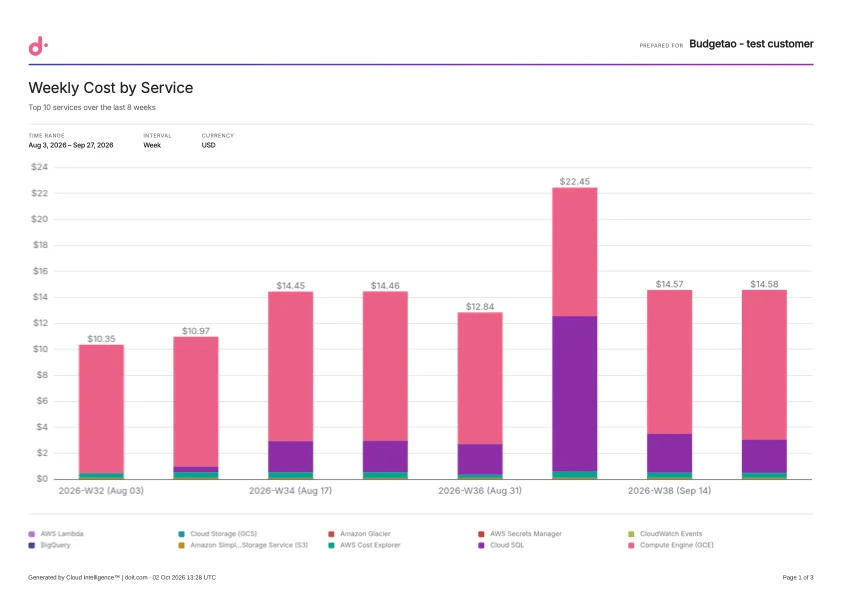
Look at the third bullet in Ava's summary and then at the chart: the Cloud SQL jump in the week of September 7 is exactly the purple spike in week 37. Ava's summary is AI-generated, so the wording changes from run to run, but it makes a useful first paragraph for a Monday morning.
What we learned building this:
- Keep the robot's permissions minimal. The pipeline service account has just two permissions:
cloudAnalyticsUserandbudgetsReadOnly. That's also why the quota check stays out of this pipeline, since it would need Manage Settings. - The robot sees only public budgets. Service accounts have no email address, so you can't add one as a budget collaborator. Budgets the pipeline should check need
public = "viewer"or higher on thedoit_budget. - Nobody copies a token by hand. The token goes from the DoiT API straight into the GitHub secret within one apply. The only other copy is the bootstrap's Terraform state, so keep that state somewhere safe.
Wrapping Up
To recap:
- The core resources got deeper: generate allocations, budgets and alerts from one map, build group allocations with
select, and let check blocks review your budgets on every plan. - Reports leave the console: render saved reports and ad-hoc queries as PDFs and PNGs, in your own theme.
- Your tenant is code now: settings, roles, users and service accounts with rotating tokens, so your pipelines no longer borrow a person's API key.
Where to go from here:
- Upgrade to v1.10 with the table at the top of this post.
- Start with the team map. It gets allocations, budgets and alerts into one configuration.
- Move your pipelines off personal API keys and onto a service account with a rotating token.
- Watch the repository's releases (Watch → Custom → Releases). The provider supports whatever the DoiT API offers, so new API capabilities show up there as they're added.
The provider is open source at github.com/doitintl/terraform-provider-doit, and the documentation has most of the examples from this post, and many more. If something's missing or awkward, open an issue and tell us.


