
Cloud Intelligence™
More tokens, less money: why token counts rank AI agent cost backwards
A one-day, one-account comparison of six agent workloads found compute cost, not token volume, decided which ones were cheapest.
This page is also available in Deutsch, Español, Français, Italiano, 日本語, and Português.
Figures are read from live dashboard screenshots of a DoiT sandbox account, not modeled from a rate card.
More tokens, less money: why token counts rank AI agent cost backwards
TL;DR: Token counts and AI agent cost can point in opposite directions. In a live AWS sandbox on 2026-08-15, the three highest-token agents were the three cheapest to run, and the three lowest-token agents were the three most expensive: a full inversion. The reason is compute, not tokens: each agent runs as its own long-running Fargate service, and Fargate made up 57 to 80% of the daily cost for the three workloads with full resource breakdowns, and as little as 26% for a fourth, lighter workload. AWS Cost Explorer can't show cost per agent at all; it pools every agent into one service-level row. A per-workload resource breakdown is what surfaces the ranking behind the bill.
If you rank AI agent cost by token consumption, you may be ranking it in precisely the wrong order.
On 2026-08-15 UTC, a settled day in our doit-apj-attribute-sandbox account in
us-east-1, the three highest-token agents in an application were also its three cheapest, and
the three lowest-token agents were its three most expensive. The token gap between
those groups runs to a factor of two and a half, and it runs in the opposite
direction from the dollars. Display rounding is nowhere near large enough to
account for that.
Every dollar and token figure below is read straight off five screenshots of that sandbox account: one live AWS Cost Explorer report and four live DoiT Attribute views. None of them is rate-card-modeled. The percentages and per-million rates are our own arithmetic on those displayed figures, labelled as such where they appear, and Cost Explorer's own "estimated charges" footnote applies to its column. A sixth image, later in the post, is an illustrative architecture diagram, not a dashboard screenshot.
What AWS Cost Explorer can't tell you about AI agent cost
Start with AWS Cost Explorer for that day: daily granularity, grouped by service, amortized costs.
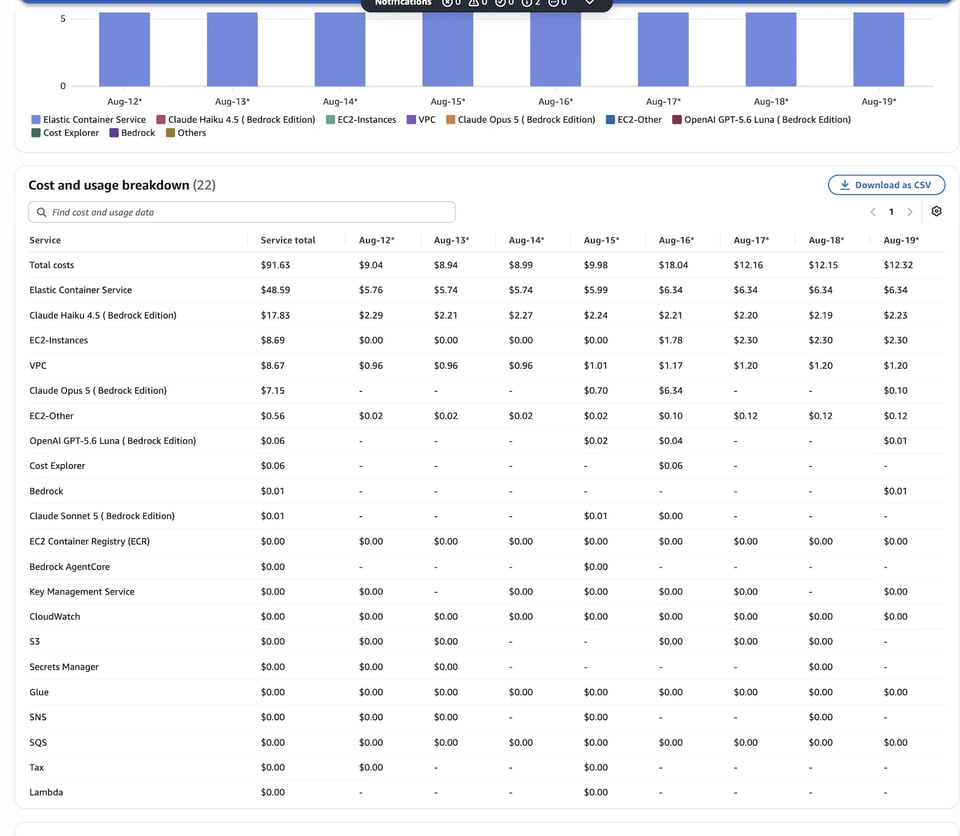
The 2026-08-15 column:
Total costs $9.98Elastic Container Service $5.99Claude Haiku 4.5 (Bedrock Edition) $2.24VPC $1.01Claude Opus 5 (Bedrock Edition) $0.70Correct, and useless for this question. Every agent in the application shares that
one $5.99 Fargate row and that one $2.24 Haiku row. The bill has a service
dimension and an account dimension. It has no agent dimension, so it cannot rank
agents at all, in either direction.
Note the report's own footnotes: dates are UTC, and current-billing-period figures are flagged as estimated.
The AI agent cost inversion
Same day, in Attribute at workload grain, filtered to the sandbox account's
luminara-* workloads:
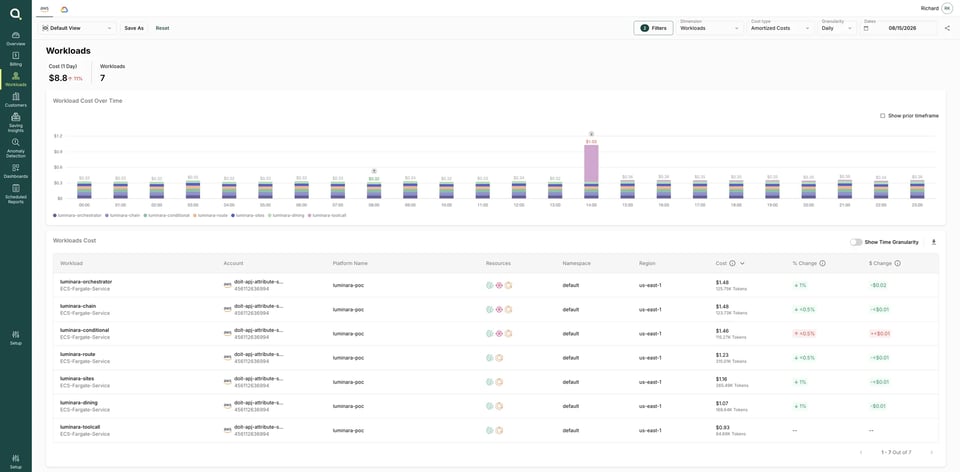
That view's own Cost (1 Day) $8.8 total is the sum of the seven luminara-*
workloads shown here, filtered to this one account. It is not comparable to
Cost Explorer's $9.98 total above, which covers every cost in the account, not
just these seven workloads' Fargate and model spend.
Reading the six luminara-* orchestration and specialist workloads off that list:
| Workload | Tokens | Cost | Token rank | Cost rank |
|---|---|---|---|---|
luminara-orchestrator |
125.75K | $1.48 | 4 | 1 |
luminara-chain |
123.73K | $1.48 | 5 | 1 |
luminara-conditional |
115.27K | $1.46 | 6 | 3 |
luminara-route |
315.01K | $1.23 | 1 | 4 |
luminara-sites |
265.49K | $1.16 | 2 | 5 |
luminara-dining |
169.64K | $1.07 | 3 | 6 |
The grouping is a clean inversion. The three lowest-token workloads are the
three highest-cost, and the three highest-token workloads are the three
lowest-cost. The sharpest single pair is luminara-route against
luminara-orchestrator: 2.5 times the tokens, and $0.25 less on the day.
The top three sit within $0.02 of each other, so their internal ordering is not meaningful at this display precision. The group-level inversion is far larger than that margin.
If your dashboard is a token counter, this application looks like it is dominated
by luminara-route, which is in fact the cheapest of the six.
Why compute, not tokens, decides AI agent cost ranking
Each luminara-* agent runs as its own long-running ECS Fargate service that
calls Bedrock for inference. That structural fact is why a Fargate line exists
at all, separate from the model line: Fargate bills for provisioned compute over
time, Bedrock bills per token consumed, and those are two independent cost axes.
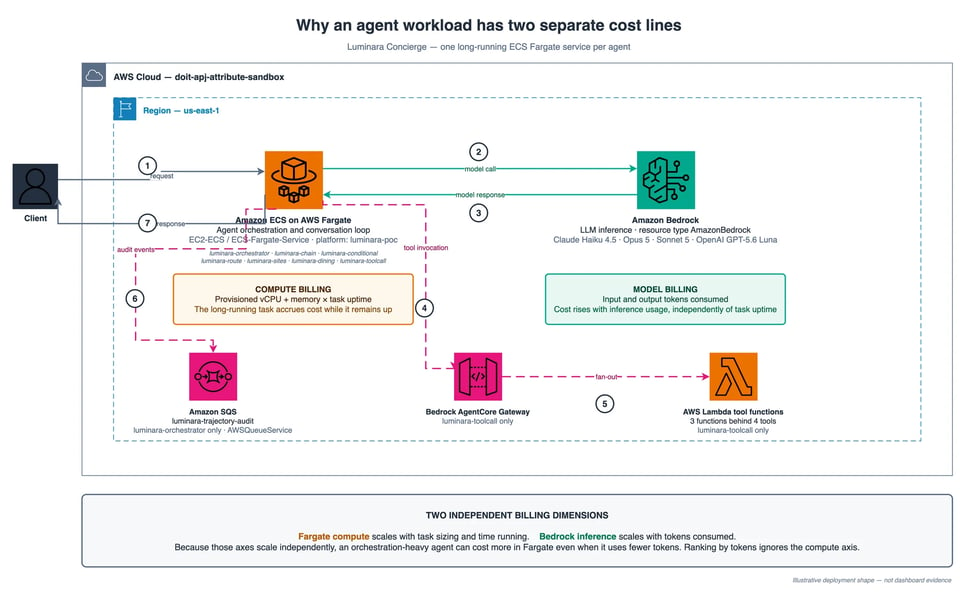
- The client sends a request to the agent's ECS Fargate service.
- The Fargate service runs the agent loop and calls Amazon Bedrock for LLM inference.
- Bedrock returns the model response to the Fargate service.
- For
luminara-toolcallonly, the Fargate service calls the Bedrock AgentCore Gateway to invoke tools. - The Gateway fans out to three Lambda functions behind four tools.
- For
luminara-orchestratoronly, the Fargate service writes audit events to theluminara-trajectory-auditSQS queue. - The Fargate service returns the final response to the client.
Attribute splits each workload into its resources. The drill-downs for the two extremes explain the inversion.
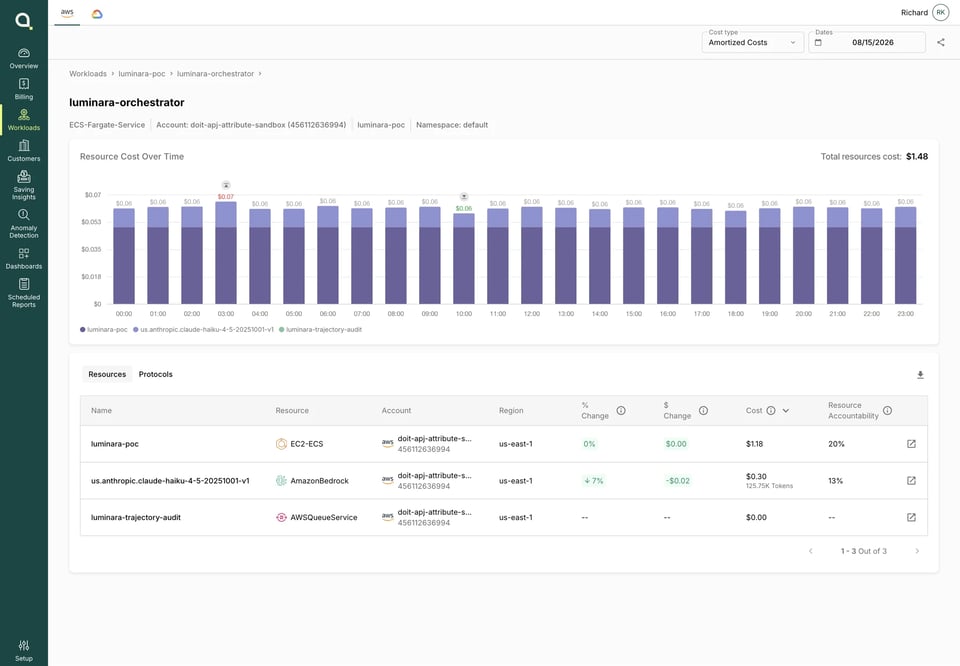
luminara-orchestrator — Total resources cost: $1.48     (1 - 3 Out of 3)
luminara-poc                                   EC2-ECS           $1.18                    20%us.anthropic.claude-haiku-4-5-20251001-v1      AmazonBedrock     $0.30   125.75K Tokens    13%luminara-trajectory-audit                      AWSQueueService   $0.00                      --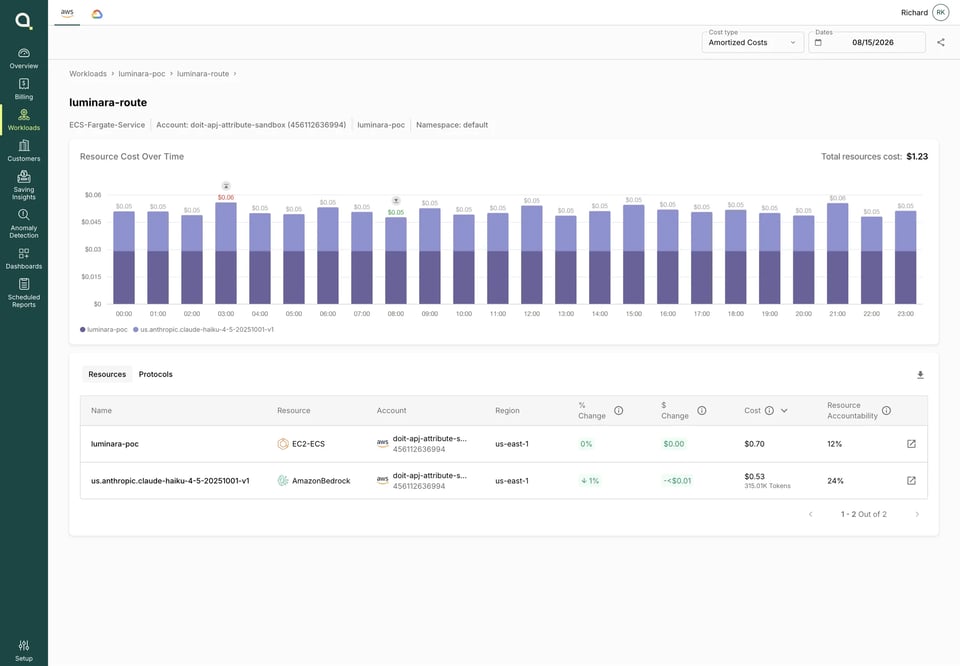
luminara-route — Total resources cost: $1.23             (1 - 2 Out of 2)
luminara-poc                                   EC2-ECS           $0.70                    12%us.anthropic.claude-haiku-4-5-20251001-v1      AmazonBedrock     $0.53   315.01K Tokens    24%
luminara-route really does spend more on the model, $0.53 against $0.30. It
gets beaten anyway, because the orchestrator's Fargate line is $1.18 against
route's $0.70.
The percentages in those two screenshots (20%, 13%, 12%, 24%) are
Attribute's own Resource Accountability metric per resource row, not a share
of workload cost; they're reproduced as displayed. The Fargate shares below are
our own arithmetic on the dollar totals, a different number.
Computing shares from those figures:
| Workload | Fargate | Model | Fargate share |
|---|---|---|---|
luminara-orchestrator |
$1.18 | $0.30 | 80% |
luminara-route |
$0.70 | $0.53 | 57% |
Compute is the majority of the daily cost in both cases, and it is the variable that decides the ranking. Tokens are the minority term that a token-based dashboard treats as the whole story.
luminara-dining rules out a two-point coincidence:
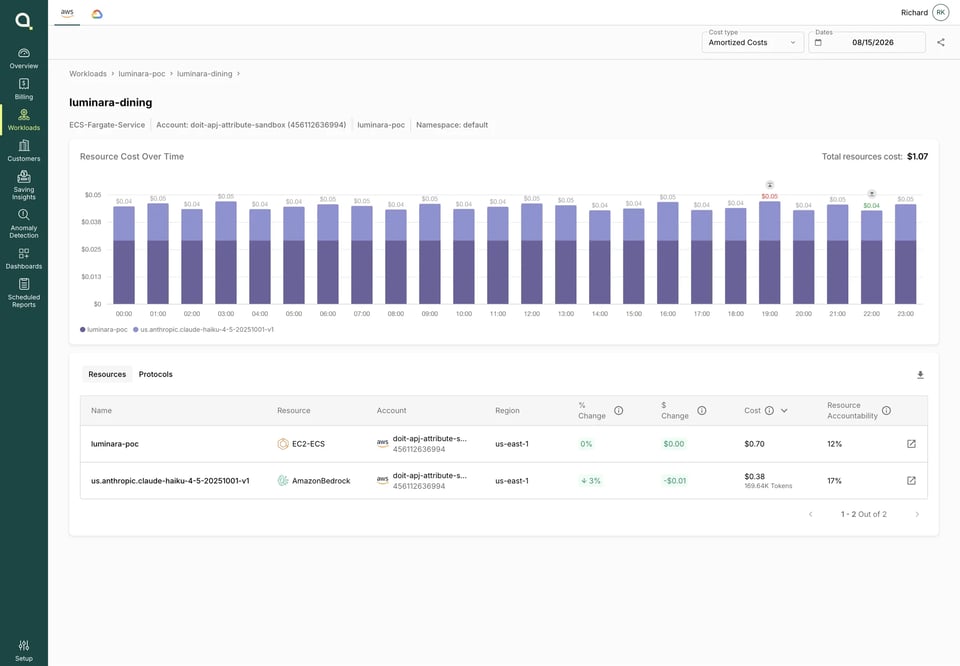
luminara-dining — Total resources cost: $1.07            (1 - 2 Out of 2)
luminara-poc                                   EC2-ECS           $0.70                    12%us.anthropic.claude-haiku-4-5-20251001-v1      AmazonBedrock     $0.38   169.64K Tokens    17%
It shows the same $0.70 Fargate line as luminara-route, two specialist services
sized alike, while the orchestrator sits at $1.18. A fourth workload,
luminara-toolcall, sits at $0.24 Fargate out of a $0.93 day, or 26%, at the
low end of the same spectrum. The resource breakdown behind that figure is
retained in the evidence set but is not reproduced in this post.
We are not claiming compute dominance as a new finding. A retained 30-day
dashboard capture ending 2026-08-21 already measured luminara-orchestrator's
EC2-ECS share at 71%, and we cite it only to show the same shape holding on a
different window. The consequence is what is new here. Because the compute term
dominates and varies by workload role, it decides the ranking, and the ranking it
produces is the reverse of the token ranking. We make no claim about architectures
beyond these workloads.
The orchestrator's third resource, luminara-trajectory-audit, is an
AWSQueueService row at $0.00. Attribute inventories the resource even when it
costs nothing that day, which is how you learn that this agent has a queue
dependency at all.
Cloud bill shouldn't be a mystery
One platform for AI and Cloud optimization.
What this means for tracking AI agent cost
Token counts are not a proxy for total AI agent cost
They are a cost proxy for the model line, and across the three workloads we drilled
into, the model line ran between 20% and 43% of the workload's daily cost. Any
per-agent cost view built purely on usage objects will mis-rank the fleet whenever
compute footprints differ, which is whenever agents differ in orchestration role,
such as a central orchestrator against narrower specialist workloads.
Ranking AI agents by cost took a per-workload view of compute
Client-side token accounting cannot see Fargate at all. The bill sees Fargate and pools it into a single row. The per-workload split above is the specific thing Attribute contributed here, and it is what flipped the answer.
Neither of those makes this an efficiency ranking. These workloads do different jobs at different request volumes; what's measured here is daily cost per workload, not cost per request, completed goal, or unit of quality. Cheaper per day is not the same as cheaper per unit of work.
FAQ
Does higher token usage mean higher AI agent cost? Not necessarily. In this analysis, the three highest-token agents were the three cheapest to run, and the three lowest-token agents were the three most expensive. Token volume tracks the model line only, not the total cost of running the agent.
Why can't AWS Cost Explorer show cost per AI agent? Cost Explorer groups by service and account, not by agent. Every agent in an application shares the same Fargate and Bedrock line items, so there's no dimension in the bill to split cost by individual agent.
What decides AI agent cost, if not tokens? Compute. Across the three workloads with full resource breakdowns, the Fargate compute line ran 57 to 80% of daily cost against 20 to 43% for the model line; a fourth, lighter workload's Fargate share was as low as 26%. Cost varies by orchestration role, not by how many tokens a workload consumes.
How do you measure cost per AI agent on shared infrastructure? By splitting each workload into its underlying resources, such as compute, model calls, and any other billed resource like a queue, rather than relying on token counts or a pooled billing line. Attribute does this at the workload level using runtime data rather than tags.
Is token-based cost estimation reliable for agentic AI systems? Not on its own. Tokens are a proxy for the model line only. A token-only view can mis-rank workloads when their compute costs differ, as it did for the six workloads measured here.
Getting AI agent cost right takes a per-workload compute view, not a token count.


