Announcement
This page is also available in Português, Deutsch, Español, Italiano, Français, and 日本語.
Visualize your Cloud Costs with Grafana
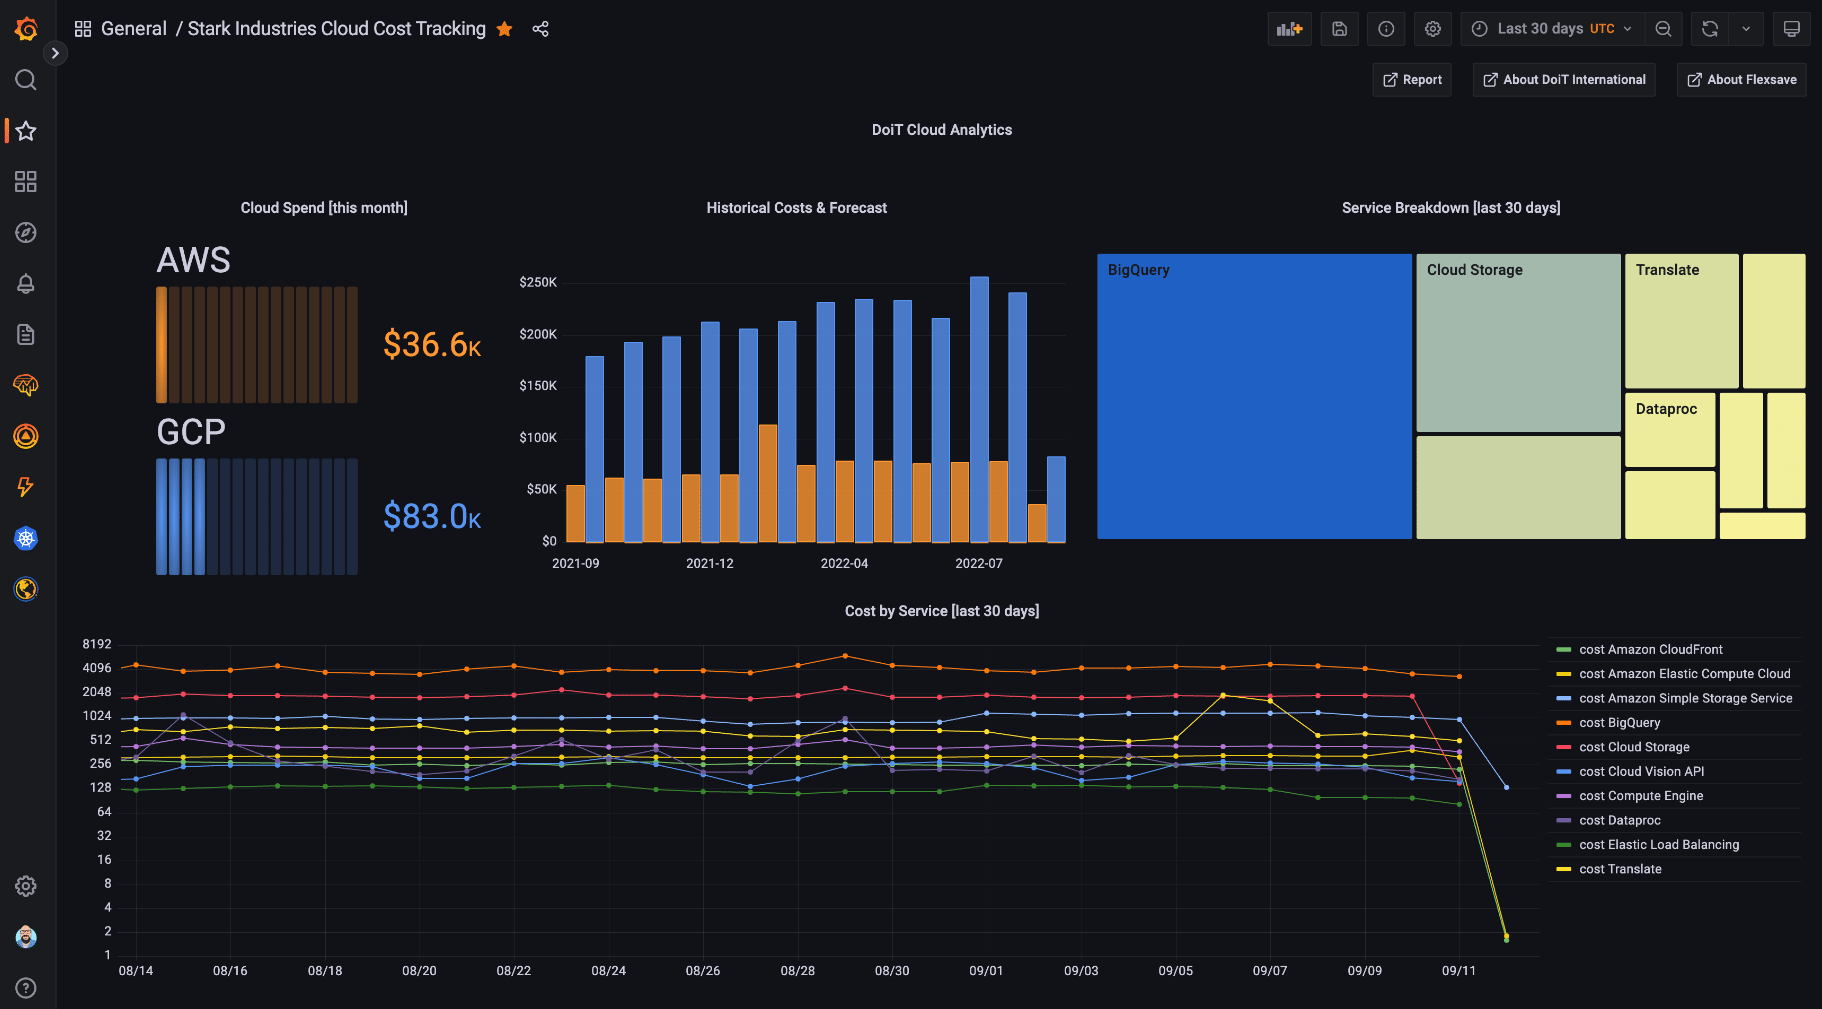
Integrate Cloud Analytics reports into Grafana for a single pane of glass combining events, cloud costs, and alerts.
DoiT Cloud Analytics allows you to build advanced cloud expenditure reports and share them with your team.
Grafana is multi-platform open source analytics and monitoring solution. It supports popular time-series data sources such as Prometheus, InfluxDB, Graphite, Elasticsearch, and more.
If you're using Grafana for monitoring your environments, adding cloud cost analytics will give you a single pane of glass that presents events, cloud costs, and alerts.