In the world of cloud computing, managing costs is just as important as the technical aspects of deploying and maintaining infrastructure. AWS, as one of the leading cloud providers, offers powerful services like Amazon RDS for managing relational databases. However, without proper monitoring and optimization, these services can quickly lead to unexpected bills. In this blog post, I will share a script I wrote for cost optimization reviews for RDS service which can help you gain visibility into unused RDS resources and reduce costs effectively.
The Challenge of Unutilized Resources
Amazon RDS is a managed database service that provides easy scalability and high availability. While this is incredibly valuable, it’s not uncommon for users to provision RDS instances with more resources than they actually need. Over time, these instances can accumulate and become an unnecessary drain on your cloud budget.
One way to tackle this problem is by monitoring your RDS instances for underutilization. You can do this by tracking CPU utilization and storage usage, among other metrics. AWS CloudWatch provides the tools necessary to gather this data. However, manually analyzing CloudWatch metrics for each RDS instance can be time-consuming and error-prone so I decided to automate it both for scalability, consistency and future reuse.
"""Module to calculade RDS utilization"""
import string
from datetime import datetime, timezone, timedelta
import sys
import openpyxl
from openpyxl.styles import PatternFill, Font
import boto3

REGION = sys.argv[1] if len(sys.argv) > 1 else "us-east-1"

EXCEL_ROW_ITER = 2

column_headers = [\
    "Instance",\
    "Class",\
    "Engine",\
    "Engine version",\
    "MultiAZ",\
    "AZ",\
    "Storage type",\
    "Allocated Storage",\
    "cpu < 25",\
    "cpu 25-50",\
    "cpu 50-74",\
    "cpu > 75",\
    "free storage < 25%",\
    "free storage 25-50%",\
    "free storage 50-74%",\
    "free storage > 75%",\
]

red = PatternFill(patternType="solid", fgColor="FC2C03")
orange = PatternFill(patternType="solid", fgColor="E57909")
green = PatternFill(patternType="solid", fgColor="35FC03")
yellow = PatternFill(patternType="solid", fgColor="FCBA03")

wb = openpyxl.Workbook()
ws = wb["Sheet"]

def get_color(usage_type, usage_value):
    """Get color for utilization"""
    if usage_type == "bl_25":
        if 0 <= usage_value <= 25:
            return green
        if 25 <= usage_value <= 50:
            return yellow
        if 50 <= usage_value <= 75:
            return red
        if usage_value >= 75:
            return red
    if usage_type in ["bt_25_49", "bt_50_74"]:
        if 0 <= usage_value <= 25:
            return red
        if 25 <= usage_value <= 50:
            return orange
        if 50 <= usage_value <= 75:
            return yellow
        if usage_value >= 75:
            return green
    if usage_type == "gt_75":
        if 0 <= usage_value <= 25:
            return yellow
        if 25 <= usage_value <= 50:
            return green
        if 50 <= usage_value <= 75:
            return orange
        if usage_value >= 75:
            return red
    else:
        return None

def fetch_metrics(db_instance_name, metricName):
    """Fetch metrics from cloudwatch"""
    stats = cw.get_metric_statistics(
        Namespace="AWS/RDS",
        MetricName=metricName,
        Dimensions=[\
            {"Name": "DBInstanceIdentifier", "Value": db_instance_name},\
        ],
        StartTime=datetime.now(timezone.utc) - timedelta(days=60),
        EndTime=datetime.now(timezone.utc),
        Period=3600,
        Statistics=["Maximum"],
    )
    return stats

def add_row_to_excel(ws, row_data):
    """Write to excel"""
    for cnt, data in enumerate(row_data):
        ws[f'{string.ascii_uppercase[cnt]}{globals()["EXCEL_ROW_ITER"]}'] = data
        if cnt == 8:
            ws[\
                f'{string.ascii_uppercase[cnt]}{globals()["EXCEL_ROW_ITER"]}'\
            ].fill = get_color("bl_25", data)
        if cnt == 9:
            ws[\
                f'{string.ascii_uppercase[cnt]}{globals()["EXCEL_ROW_ITER"]}'\
            ].fill = get_color("bt_25_49", data)
        if cnt == 10:
            ws[\
                f'{string.ascii_uppercase[cnt]}{globals()["EXCEL_ROW_ITER"]}'\
            ].fill = get_color("bt_50_74", data)
        if cnt == 11:
            ws[\
                f'{string.ascii_uppercase[cnt]}{globals()["EXCEL_ROW_ITER"]}'\
            ].fill = get_color("gt_75", data)

    globals()["EXCEL_ROW_ITER"] += 1

# Initialize Boto3 clients
rds = boto3.client("rds", region_name=REGION)
cw = boto3.client("cloudwatch", region_name=REGION)

# Define column headers
for cnt, header in enumerate(column_headers):
    cell_address = f"{string.ascii_uppercase[cnt]}1"
    ws[cell_address] = header
    ws[cell_address].font = Font(bold=True)

# Fetch RDS instances
response = rds.describe_db_instances()
print(f'Found {len(response["DBInstances"])} databases')
for instance_data in response["DBInstances"]:
    db_instance_name = instance_data["DBInstanceIdentifier"]
    db_type = instance_data["DBInstanceClass"]
    db_storage = instance_data["AllocatedStorage"]
    db_engine = instance_data["Engine"]
    db_engine_version = instance_data["EngineVersion"]
    db_multiaz = instance_data["MultiAZ"]
    db_az = instance_data["AvailabilityZone"]
    db_storage_type = instance_data["StorageType"]

    if db_engine == "docdb":
        continue  # Skip docdb instances
    print(f"Pulling information for {db_instance_name}")
    cpu_metrics = fetch_metrics(db_instance_name, "CPUUtilization")

    # Calculate usage percentages
    usage_values = [d["Maximum"] for d in cpu_metrics["Datapoints"]]
    cpu_usage_percentages = [\
        round(\
            sum(1 for value in usage_values if 25 * i <= value < 25 * (i + 1))\
            / len(usage_values)\
            * 100,\
            1,\
        )\
        for i in range(4)\
    ]
    for i, usage in enumerate(cpu_usage_percentages):
        print(f"\tCPU {25 * i}% <= value < {25 * (i + 1)}%: {usage}%")
    storage_usage_percentages = []

    if db_storage_type != "aurora":
        print("\tStorage found")
        storage_metrics = fetch_metrics(db_instance_name, "FreeStorageSpace")
        storage_usage_values = [d["Maximum"] for d in storage_metrics["Datapoints"]]
        storage_usage_percentages = [\
            round(\
                sum(\
                    1\
                    for value in storage_usage_values\
                    if 25 * i\
                    <= value / (1024 * 1024 * 1024) / db_storage * 100\
                    < 25 * (i + 1)\
                )\
                / len(storage_usage_values)\
                * 100,\
                1,\
            )\
            for i in range(4)\
        ]
        for i, usage in enumerate(storage_usage_percentages):
            print(f"\tStorage {25 * i}% <= value < {25 * (i + 1)}%: {usage}%")
    # Add data to Excel worksheet
    row_data = (
        [\
            db_instance_name,\
            db_type,\
            db_engine,\
            db_engine_version,\
            db_multiaz,\
            db_az,\
            db_storage_type,\
            db_storage,\
        ]
        + cpu_usage_percentages
        + storage_usage_percentages
    )
    add_row_to_excel(ws, row_data)

# Save the Excel workbook
wb.save("results.xlsx")
Automating Cost Reduction with Python
To streamline the process of identifying underutilized RDS instances, we can turn to Python, a versatile and widely-used programming language.
1. Fetching RDS Instance Data
The script begins by connecting to AWS and fetching data about your RDS instances. It collects crucial information such as instance names, types, storage, and more.
2. Gathering Metric Data
The script then queries AWS CloudWatch for CPU utilization and storage usage metrics. These metrics provide insights into how effectively your RDS instances are being utilized.
3. Calculating Utilization Percentages
Using the gathered metrics, the script calculates utilization percentages for both CPU and storage. These percentages are categorized into different usage levels (e.g., low, moderate, high) based on predefined thresholds.
4. Visualizing the Data
The script doesn’t stop at just gathering data; it also creates an Excel spreadsheet with the collected information. The script uses color-coded cells to highlight instances with different utilization levels, making it easy to spot underutilized resources at a glance.
Putting the Script to Use
To make the most of this cost-saving script, follow these steps:
1. Prerequisites
- Ensure you have Python installed on your system.
- Install the required Python libraries:
boto3andopenpyxl.
pip3 install boto3 openpyxl
2. AWS Configuration
- Make sure your AWS credentials are properly configured on your machine. Run the get-caller-identity command and make sure you are on the right account with the appropriate permissions.
aws sts get-caller-identity
{
    "UserId": "AIDAV7DHVCA7557LUGTRA",
    "Account": "410386763839",
    "Arn": "arn:aws:iam::410386763839:user/bogdan"
}
3. Run the Script
- Execute the Python script, providing the desired AWS region as an argument (or use the default ‘us-east-1’).
python3 run.py us-east-2
4. Review the Excel Report
- The script generates an Excel report named “results.xlsx” that visually highlights underutilized RDS instances. Review this report to identify cost-saving opportunities.
5. Take Action
- Based on the report, consider resizing or terminating underutilized RDS instances to reduce costs.
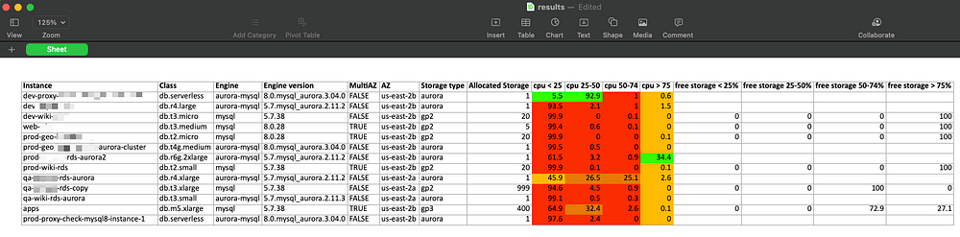
Interpreting results
The script fetches maximum CPUUtilization metricin the past 60 days in 1 hour periods and puts it in 4 utilization buckets: 0–25, 25–50, 50–75 and 75–100.
Then the script calculates the percentage of total hours in each bucket from the total working hours of the instance.
In the sample results above, we can see that most of the databases spend most of their time below 25% cpu load — these are the first candidates for downsizing/consolidation or termination.
For storage usage, it pulls the FreeStorageSpace metric for the past 60 days in 1 hour buckets, calculates it percentage out of the total provisioned storage and puts it into 4 corresponding buckets.
We can see that some of the databases are using provisioned storage (gp2/gp3). We can see for some of them that in 100% of the sampled hours, there is 75% or more free storage. It’s a clear indicator that the storage size can be reduced in these databases.
Managing AWS costs is an essential aspect of cloud infrastructure management. This Python script simplifies the process of gaining visibility into underutilized RDS resources, making it easier to identify opportunities for cost reduction. By automating the analysis of CloudWatch metrics and visualizing the results in an Excel report, you can make data-driven decisions to optimize your AWS spending.
Although it cannot be compared with off the shelf ready to use monitoring solutions, it gives you the flexibility to slice and dice the data as you wish as well as present it the way you want. In the next series I will be adding more cost related features to the report so stay tuned.