As more companies undergo digital transformation and move more of their online offerings to cloud infrastructure, the size, scope, and complexity of these cloud architectures continue to grow.
Containerization of cloud workloads and container orchestration through Kubernetes are perfect examples of this trend. Kubernetes clusters grew in public cloud environments by a rate of 127% in 2022, five times faster than containers hosted on-premises. And among those cloud-based Kubernetes clusters, the vast majority (73%) are built on managed distribution systems offered by cloud providers, such as Amazon Elastic Kubernetes Service (EKS).
Yet as these container environments and Kubernetes workloads grow in scope, the need for fast deployments and instant results can often have an adverse effect on a company’s ongoing cost optimization efforts. This can be due to a lack of visibility into these workloads, the absence of ownership for those costs, or simply a lack of available time and resources to properly manage and optimize on an ongoing basis. In fact, Flexera reports not only that “managing cloud spend” is the number one challenge for both enterprise and SMB companies, but also that 68% of users with containerized workloads report having trouble managing those costs.
To make matters more challenging, this endeavor is not one that is easily solved with native tooling. While AWS Cost Explorer allows you to build reports for your EKS nodes, you have to be sure that all of those nodes are properly tagged with the appropriate labels to ensure data integrity, which is something that is easier said than done over the course of multiple EKS deployments.
And if you’re looking for more granularity, you have to either purchase a third-party solution, or go through the clunky and time-consuming process of downloading your full Cost and Usage Report (CUR) from Amazon to extract more specific data on costs/usage from individual pods, namespaces, clusters, or time intervals.
It was with this context in mind that we recently released our EKS Lens within DoiT Cloud Navigator for AWS customers with EKS workloads. This out-of-the-box dashboard provides engineering, product, and FinOps teams with pre-built reports designed to demystify EKS spend and more accurately track the total cost of ownership (TCO) of Kubernetes-based workloads across teams and product lines.
What is included in EKS Lens?
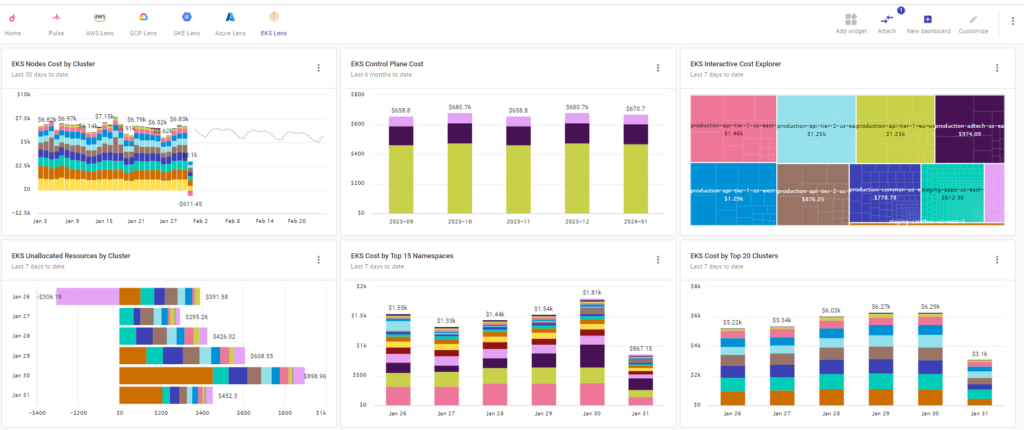
Similar to DoiT’s other preset dashboards like Pulse and GKE Lens, EKS Lens consists of seven preset report widgets that provide an at-a-glance view of your full EKS environment. It does this by taking your K8s metrics and integrating them with your AWS billing data to see costs per pod, namespace, cluster, etc.:
- EKS Nodes Cost by Cluster
- Control Plane Cost
- Interactive EKS Cost Explorer
- Unallocated Resources by Cluster
- Cost by Top 15 Namespaces
- Cost by Top 20 Clusters
- Cluster Utilization
From this single pane of glass, each of these widgets can be expanded into a customizable Cloud Analytics report that allows you to drill down for more granularity, change the timeframe of the report, or add additional metrics and services to expand the scope.
By providing reports with Kubernetes data broken down along these timeframes and dimensions, it becomes much easier to map K8s costs to business groupings that matter most to your specific use case, such as applications or engineering teams.
Additionally, the ability to customize and share these reports via Slack, Teams, email, or other third-party communication tools makes it much easier to engage the rest of your FinOps team and drive collaboration across the organization.
To learn more about how you can drill down into an individual report directly from the EKS Lens dashboard, check out this interactive walkthrough:
Getting started with EKS Lens
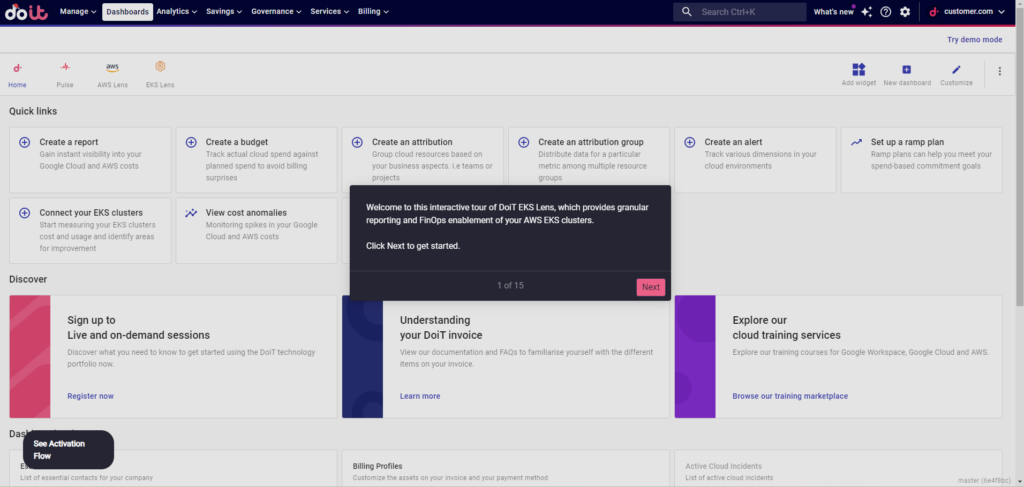
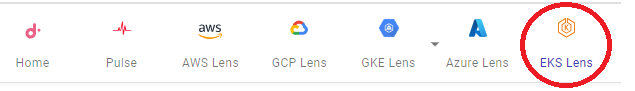
All AWS customers with connected billing accounts will automatically have the EKS Lens tile appear on the upper tool bar of the Cloud Navigator home screen as soon as any EKS workloads are detected.
However, this dashboard will not be populated with data until you connect your EKS clusters, which is done by deploying an agent in your Kubernetes account, and then creating a CloudFormation stack in AWS Cost Explorer. From there, DoiT integrates the K8s metrics with your cloud billing data to group your cost data by pods, namespaces, clusters, etc. to glean tangible business insights.
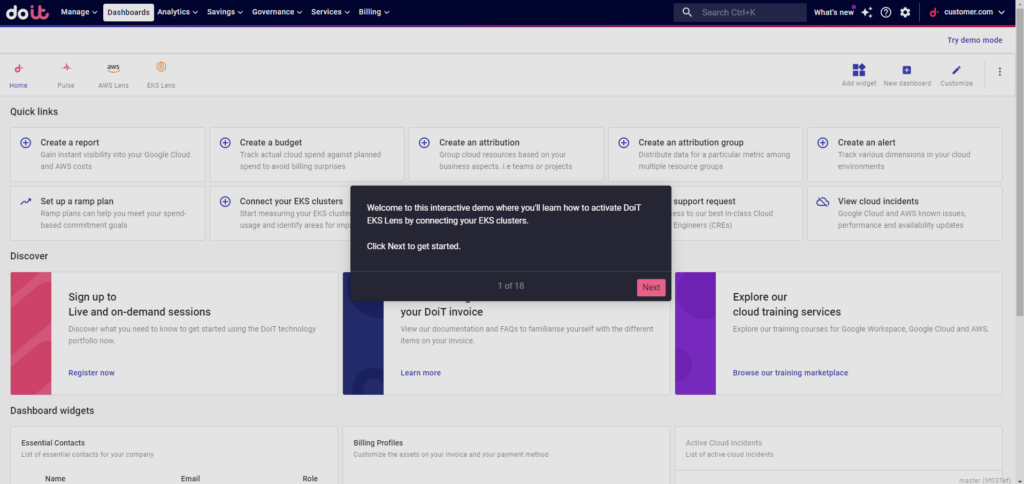
You can see the complete activation process, including details about the Kubernetes agent and the CloudFormation stack, in this interactive demo:
To learn more about how DoiT can help manage and contextualize your Kubernetes spend through EKS Lens and other features within DoiT Cloud Navigator, or to get more information about DoiT’s on-demand Kubernetes training and Accelerator offerings within DoiT Cloud Solve, get in touch with one of our experts.