


Key flaws in the modern data warehousing approach
The following is an all-too-common scenario — one that has gone without a solution for decades — that is likely to be familiar to many data engineers, business analysts, and data-driven executives:

Confusion is an inevitable moment for any data-centric career path
Your organization has multiple teams/groups/departments, each with its own data team processing, storing, and creating reports on its own datasets. Communication is minimal across groups. When cross-team data access is required, host dataset engineers may grant data access as needed, but rarely do they participate in code reviews to verify that the requester is querying the data properly, or at least in a manner that is consistent with the host team’s queries. Even simple ideas can sometimes be challenging to express in SQL, and thus as an organization grows in size and its questions grow in complexity, validating queries from another team becomes a time-consuming roadblock to cross-team data processing code validation.
As a result of this minimal collaboration, executives compiling data and charts for use in decision-making and presentations may sometimes notice that when pulling figures created on similar topics across groups, one group’s charts may present substantially different numbers from figures generated by another group using the same underlying raw data. Executives may thus notice that conclusions drawn by one group are at odds with conclusions drawn by another group.
When executives seek solutions for this inconsistency from their engineering teams, they often find few remedies. Reasons for this can include:
- The enormity of the problem in comparison to group size. Hundreds of queries may come from just one group, each requiring validation and potential correction from other groups. There simply isn’t enough manpower and time available to dedicate to cross-team data pipeline code reviews.
- The datasets underlying queries in one group may be so irrelevant to another group that it would not be a valuable use of time for engineers from another group to learn in order to properly engage in cross-team validation work. A single query can potentially be complex, involve hundreds of lines of code, and include joins to datasets that the reviewing engineer has little business need to understand outside the context of the code review. Comprehending such SQL is time-intensive for anyone but the original developer(s).
Considering these obstacles, leadership might opt to employ a data analyst who will handle their queries, placing their trust in this individual to deliver reliable reports. However, this strategy sidesteps the fundamental issue: Different groups derive varied results from the same raw data when probing similar or connected queries. This inconsistency can lead to varying data-driven decisions within an organization, even when groups within the organization are pulling from the same raw data. Moreover, as this leadership analyst must communicate with multiple groups for their datasets, they are likely to perpetuate the existing discrepancies in data processing between groups.

We’ve all heard the saying before
In a data-driven world, confidently trusting the data driving decision-making is everything. As the machine learning saying goes:
Garbage (data) in, garbage (predictions) out.
Simply connecting all your raw data sources into a cutting-edge data warehouse — BigQuery, Snowflake, Redshift, etc. — and giving access as needed to this data does not solve the root problems of company-wide consistent data processing, a general lack of cross-team collaboration, and the collective trustworthiness of results across every department.
Taking the typical segmented team approach to data warehousing and analytics means that few — if any — of the queries and data sources from one team are readily reusable by another team. Siloed report generation eventually becomes entrenched, and groups ultimately wind up only trusting what their own data team produces. Leadership is left without a confident, consistent view of their organization.
Malloy: Purpose-built for collaborative data warehouse querying

The official logo for Malloy, a query language that will make your life much easier
Enter Malloy, an analytical language brought to you by the former founders and developers of Looker / LookML now working within Google.
Designed to overcome the limitations of SQL — a language that launched 44 years ago in 1979 long before data warehouses were a thing — Malloy is, in ironic essence, a SQL compiler, but it is so much more than that. There are several key advantages to building your data infrastructure with Malloy-generated SQL in mind rather than asking engineering teams for artisanal, hand-crafted SQL. Before we dive into those advantages, however, let’s hear directly from the Malloy team on why we even need a replacement for SQL:
From Ben Porterfield, co-founder of Looker and Malloy
SQL is a powerful language that can express any possible query, but it has its downsides:
Everything is expressible, but nothing is reusable
Simple ideas are complex to express
The language is verbose and lacks smart defaults
Malloy is immediately understandable by SQL users, and far easier to use and learn [1][1] https://malloydata.github.io/documentation/about/features.html
From Carlin Eng, Malloy Product Manager
Language is a tool for thought, and improving the syntax of a language has deep implications for what we can imagine and what we can express. SQL was invented in the 1970s before data warehouses existed, and thus could not have been designed with today’s use cases in mind.
In contrast, Malloy is purpose-built for analyzing complex datasets.
With those points in mind, developing with Malloy instead of SQL gives you the following advantages:
- A simple and succinct syntax for writing even the most complex queries. Gone are the days of writing line after line of boilerplate SQL and struggling with effectively and efficiently gathering challenging data points without copious usage of temporary tables. The language’s simplicity greatly enhances:
- Collaborative development
- Speed of development
- Trustworthiness of outputs
2. A modular and reusable code base! Examples of this include:
- Complex data sources can be defined, then used as the basis for other sources and queries. Data source complexity can be minimized by breaking up a complex source into several simpler parent-and-child relationship data sources.
- Pipelining of operations. The output of one query can be the input for another query.
3. Dashboard performance-optimized SQL generation
- The SQL compiler is well-optimized and outperforms all complex hand-written queries I have compared its performance against. This is important because time is money — quite literally. Look into the pricing schemes for BigQuery Editions, Snowflake, and serverless Redshift.
4. (Coming soon) Automated recreation of tables / views after updates to Malloy sources and queries are made
- Let’s say you have a Malloy source defined, 100 queries hit that source, and the SQL generated from each query is responsible for creating a BigQuery table. Let’s next assume you discovered a bug in how the Malloy source is filtered, and thus need to make a crucial filter change to the source. After updating the source’s filter, you can automate the recreation of all 100 BigQuery tables by having the Malloy engine rerun all downstream queries dependent on that upstream source. Metadata associated with each query informs the Malloy engine which BigQuery table a Malloy query should recreate.
5. …and more!
Let’s walk through a practical example to understand how these features can come together to benefit an organization and enable it to operate at scale more effectively.
Malloy in action: A real-world production use-case
Let’s say you work for a company with a customer support ticketing system. Through this system, tickets are taken on topics spanning multiple groups: Technical tickets, sales engagement tickets, and finance tickets. Thus, the engineering, sales, and finance teams are interested in capturing various metrics relating to how tickets are handled, but each group is generally only interested in capturing metrics related to their own group.
Without Malloy, this scenario typically means that an engineer from each group will get access to the raw ticketing system dataset and manipulate the data as they see fit to generate the required metrics and reports. There may even be multiple data engineers within a group that operate mostly independently, filtering and joining and aggregating data in ways that differ slightly from engineers within the same group.
This approach to reporting is unfortunate, as there are many challenging filters and edge cases to account for, and it is unlikely that all data engineers working with this dataset will independently discover them all. Examples of issues that should be handled before the calculation of key metrics can include:
- The need to remove ‘spam’-like tickets from consideration
- The need to remove ‘scrubbed’ tickets removed for a variety of reasons, e.g. containing PII data
- The need to remove internally-generated tickets, e.g. from app testing
- The need for reproducibility across groups for challenging calculations, such as: Time to ticket assignment, first response time, escalation response time, ticket solve time, SLO breach time, etc.
- The need for clear differentiation between similar dimensions. For example: Original vs. current vs. highest vs. lowest ticket priority level assigned throughout a ticket’s history. When a report refers to ticket priority, which of these is being referenced?
- The ability to capture valuable dimensions scraped from certain tickets via complex regular expressions, where the scraped text can take the form of several different formats.
With Malloy, all of these concerns start to become trivial.
Engineers working on this problem with cross-department functionality in mind could begin by writing a foundational Malloy source that all groups will use — we’ll call it tickets. In handling all of the problems highlighted above, the tickets source could look similar to the following pseudocode:
source: tickets is table('bigquery_project.dataset_name.table_name'){
    primary_key: id
    where:
        spam_ticket = false,
        scrubbed_ticket = false,
        internal_test_ticket = false
    join_one: priority_history on priority_history.ticket_id = id
    join_one: agents is users on agents.id = assignee_id
    dimension: priority_original is priority_history.priority_original
    dimension: priority_highest is priority_history.priority_highest
    dimension: priority_highest_chartable is priority?
        pick '1_urgent' when 'urgent'
        pick '2_high' when 'high'
        pick '3_normal' when 'normal'
        pick '4_low' when 'low'
        else null
    dimension: priority_current is priority
    dimension: agent_is_engineer is agents.agent_is_engineer
    dimension: agent_is_sales is agents.agent_is_sales
    dimension: agent_is_finance is agents.agent_is_finance
    dimension: special_request_requester_email is
        pick coalesce(lower(regexp_extract(description, r'Requested by: (\S+@doit(?:-intl)?\.com)\n')), lower(regexp_extract(subject, r'^(\S+@doit(?:-intl)?\.com) ', 1))) when is_special_request = true
        else null
    dimension: time_to_solve_hours is seconds(created_at to solved_at) / 3600
    measure: avg_solve_time_hours is round(avg(time_to_solve_hours), 1)
    measure: ticket_count is count(distinct id)
}
The code defining the Malloy sources we join to tickets— users and priority_history— is not shown, but we do not need to see it to understand how those sources are being used. Their use in defining dimensions that are related to the agent’s job role and ticket priority history is clear. How those dimensions being pulled into the tickets source are defined is largely irrelevant. Such is the beauty of a code base taking advantage of Malloy’s modular nature.
With this foundational source in place (itself dependent on joins to two other sources), you could then create multiple child sources dependent on the tickets source, each specific to a departmental group:
source: engineering_tickets is tickets {
    where: agent_is_engineer = true
}
source: sales_tickets is tickets {
    where: agent_is_sales = true
}
source: finance_tickets is tickets {
    where: agent_is_finance = true
}
Now that we have a Malloy source specifically tailored for use by each department, where multiple complex filters, dimensions, and edge cases have been handled under the hood, engineers within each group can ask queries on tickets and trust that the way their metrics are calculated (e.g. the tickets being considered and the math behind metric calculation) will match across groups. Note that the algorithm behind the metric avg_solve_time_hours is defined in the tickets source, yet invoked through the aggregate command in child sources:
query: avg_solve_time_engineering is engineering_tickets -> {
    aggregate: avg_solve_time_hours
}
query: avg_solve_time_sales is sales_tickets -> {
    aggregate: avg_solve_time_hours
}
query: avg_solve_time_finance is finance_tickets -> {
    aggregate: avg_solve_time_hours
}
Let’s say each team also wants to know how many tickets had been generated within their department over the past three months where at some point in the ticket’s history it was an urgent/P1 issue:
query: tickets_past_3_months_engineering is engineering_tickets -> {
    where:
        priority_highest_chartable = '1_urgent',
        created_at >= now - 3 months
    aggregate: ticket_count
}
query: tickets_past_3_months_sales is sales_tickets -> {
    where:
        priority_highest_chartable = '1_urgent',
        created_at >= now - 3 months
    aggregate: ticket_count
}
query: tickets_past_3_months_finance is finance_tickets -> {
    where:
        priority_highest_chartable = '1_urgent',
        created_at >= now - 3 months
    aggregate: ticket_count
}
Malloy queries such as these — which are surprisingly easy to read due to the modular nature of the language — may compile into hundreds of lines of SQL depending on how many parent source dependencies, joins, filters, and aggregations exist within each of the sources your query depends on.
That SQL will run much faster — and more cost-effectively — than any hand-written equivalent.
This modular alternative to SQL also means that if a bug is discovered in one query, it simply requires stepping through a series of upstream, easy-to-read, low-ish complexity sources to eventually discover and correct the bug. Then, once the bug has been corrected, all queries — and the database tables/views they power — dependent on that updated source can be quickly re-run and re-built.
Bug fixes from one group can thus be seamlessly and rapidly integrated into the work of other groups building on the same Malloy data sources.
How clear and concise can Malloy code really be?
The Malloy source and query examples above highlight the modular nature of the language well, but they don’t do it justice in terms of showcasing how clear it can be when asking complex questions.
Let’s take a look at the priority_history source which, as we saw above, joins into the tickets source to provide dimensions that highlight the priority history for a ticket, namely: Original, current, and the historically highest priority for a ticket.
Determining these priorities requires searching the history of changes made to a ticket, which requires a query with multiple nested queries. Nested queries in SQL are ugly; nested queries in Malloy are clean and easy to read. Let’s compare how priority_history is defined in each language, starting with Malloy:
source: priority_history is from(field_history{where: field_name = 'priority'} -> {
    group_by: ticket_id
    nest: priority_original is {
        group_by: priority_original is value, updated
        order_by: updated asc
        limit: 1
    }
    nest: priority_final is {
        group_by: priority_final is value, updated
        order_by: updated desc
        limit: 1
    }
    nest: priority_urgent_present is {
        group_by: priority_urgent_present is true
        where: value = 'urgent'
        limit: 1
    }
    nest: priority_high_present is {
        group_by: priority_high_present is true
        where: value = 'high'
        limit: 1
    }
    nest: priority_normal_present is {
        group_by: priority_normal_present is true
        where: value = 'normal'
        limit: 1
    }
    nest: priority_low_present is {
        group_by: priority_low_present is true
        where: value = 'low'
        limit: 1
    }
} -> {
    project:
        ticket_id,
        priority_original.priority_original,
        priority_final.priority_final,
        priority_highest is
            pick 'urgent' when priority_urgent_present.priority_urgent_present = true
            pick 'high' when priority_high_present.priority_high_present = true
            pick 'normal' when priority_normal_present.priority_normal_present = true
            pick 'low' when priority_low_present.priority_low_present = true
            else null
    order_by: ticket_id desc
})
Compare that to the dashboard-optimized SQL it generates:
WITH __stage0 AS (
  SELECT
    group_set,
    CASE WHEN group_set IN (0,1,2,3,4,5,6) THEN
      field_history.ticket_id
      END as ticket_id__0,
    CASE WHEN group_set=1 THEN
      field_history.value
      END as priority_original__1,
    CASE WHEN group_set=1 THEN
      field_history.updated
      END as updated__1,
    CASE WHEN group_set=2 THEN
      field_history.value
      END as priority_final__2,
    CASE WHEN group_set=2 THEN
      field_history.updated
      END as updated__2,
    CASE WHEN group_set=3 THEN
      true
      END as priority_urgent_present__3,
    CASE WHEN group_set=4 THEN
      true
      END as priority_high_present__4,
    CASE WHEN group_set=5 THEN
      true
      END as priority_normal_present__5,
    CASE WHEN group_set=6 THEN
      true
      END as priority_low_present__6
  FROM `project-name.dataset-name.table-name` as field_history
  CROSS JOIN (SELECT row_number() OVER() -1  group_set FROM UNNEST(GENERATE_ARRAY(0,6,1)))
  WHERE (field_history.field_name='priority')
  AND ((group_set NOT IN (3) OR (group_set IN (3) AND field_history.value='urgent')))
  AND ((group_set NOT IN (4) OR (group_set IN (4) AND field_history.value='high')))
  AND ((group_set NOT IN (5) OR (group_set IN (5) AND field_history.value='normal')))
  AND ((group_set NOT IN (6) OR (group_set IN (6) AND field_history.value='low')))
  GROUP BY 1,2,3,4,5,6,7,8,9,10
)
, __stage1 AS (
  SELECT
    ticket_id__0 as ticket_id,
    ARRAY_AGG(CASE WHEN group_set=1 THEN STRUCT(
      priority_original__1 as priority_original,
      updated__1 as updated
      ) END IGNORE NULLS  ORDER BY  updated__1 asc  LIMIT 1) as priority_original,
    ARRAY_AGG(CASE WHEN group_set=2 THEN STRUCT(
      priority_final__2 as priority_final,
      updated__2 as updated
      ) END IGNORE NULLS  ORDER BY  updated__2 desc  LIMIT 1) as priority_final,
    ARRAY_AGG(CASE WHEN group_set=3 THEN STRUCT(
      priority_urgent_present__3 as priority_urgent_present
      ) END IGNORE NULLS  ORDER BY  priority_urgent_present__3 asc  LIMIT 1) as priority_urgent_present,
    ARRAY_AGG(CASE WHEN group_set=4 THEN STRUCT(
      priority_high_present__4 as priority_high_present
      ) END IGNORE NULLS  ORDER BY  priority_high_present__4 asc  LIMIT 1) as priority_high_present,
    ARRAY_AGG(CASE WHEN group_set=5 THEN STRUCT(
      priority_normal_present__5 as priority_normal_present
      ) END IGNORE NULLS  ORDER BY  priority_normal_present__5 asc  LIMIT 1) as priority_normal_present,
    ARRAY_AGG(CASE WHEN group_set=6 THEN STRUCT(
      priority_low_present__6 as priority_low_present
      ) END IGNORE NULLS  ORDER BY  priority_low_present__6 asc  LIMIT 1) as priority_low_present
  FROM __stage0
  GROUP BY 1
  ORDER BY 1 asc
)
, __stage2 AS (
  SELECT
     base.ticket_id as ticket_id,
     priority_original_0.priority_original as priority_original,
     priority_final_0.priority_final as priority_final,
     CASE WHEN priority_urgent_present_0.priority_urgent_present=true THEN 'urgent' WHEN priority_high_present_0.priority_high_present=true THEN 'high' WHEN priority_normal_present_0.priority_normal_present=true THEN 'normal' WHEN priority_low_present_0.priority_low_present=true THEN 'low' ELSE NULL END as priority_highest
  FROM __stage1 as base
  LEFT JOIN UNNEST(base.priority_urgent_present) as priority_urgent_present_0
  LEFT JOIN UNNEST(base.priority_high_present) as priority_high_present_0
  LEFT JOIN UNNEST(base.priority_normal_present) as priority_normal_present_0
  LEFT JOIN UNNEST(base.priority_low_present) as priority_low_present_0
  LEFT JOIN UNNEST(base.priority_original) as priority_original_0
  LEFT JOIN UNNEST(base.priority_final) as priority_final_0
  ORDER BY 1 desc
)
SELECT
   priority_history.ticket_id as ticket_id,
   priority_history.priority_original as priority_original,
   priority_history.priority_final as priority_final,
   priority_history.priority_highest as priority_highest
FROM __stage2 as priority_history
Which of those examples would you prefer to debug?
Remember that tickets_history is just one of many Malloy sources that joined into the tickets source so that its dimensions could be used in ticket analytics, and thus represents only a small piece of the complexity that would underly the tickets source’s SQL. Imagine the complexity involved in writing and debugging the SQL for the tickets source if you were to join 20 Malloy sources to tickets and use dimensions/measures from each of those joins, as I have done.
Malloy + Looker: Efficient, scalable, collaborative. Trustworthy data engineering realized.
“The Whole is Greater than the Sum of its Parts” — Aristotle
The examples described above are not fictional, but rather reflective of the collaborative data journey I kicked off here at DoiT International. I sought to help unify the exploration of multiple data systems (data from tickets, sales, users, employees, and so on) all within a framework that maximizes the trust with which leadership can place in analytics run on those datasets and minimizes the onramp effort required for fellow data engineers to contribute.
While Malloy is a fantastic tool that certainly enhances this journey towards collaborative analytics, by itself the language does not enable ease of use by end-users that are more interested in quickly generating reports and less interested in learning a new language (i.e. leadership / upper management). To address this, I discovered Malloy truly shines when used in conjunction with cutting-edge dashboard tools, such as Looker.
Compared to other BI tools, Looker is purpose-built to act as a centralized source of truth. If set up properly via dimension and measure definitions written in its proprietary LookML language, intuitive chart generation for just about anything you can imagine can be taught — even to non-technical folks — in just a few minutes. Users have only to click on the dimensions and measures they want to see (which can potentially span multiple tables), optionally engage in a few more clicks that add filters or pivot on a dimension, and hit Run. Once you become familiar with Looker’s Explore UI, generating a chart spanning multiple data sources can take seconds.
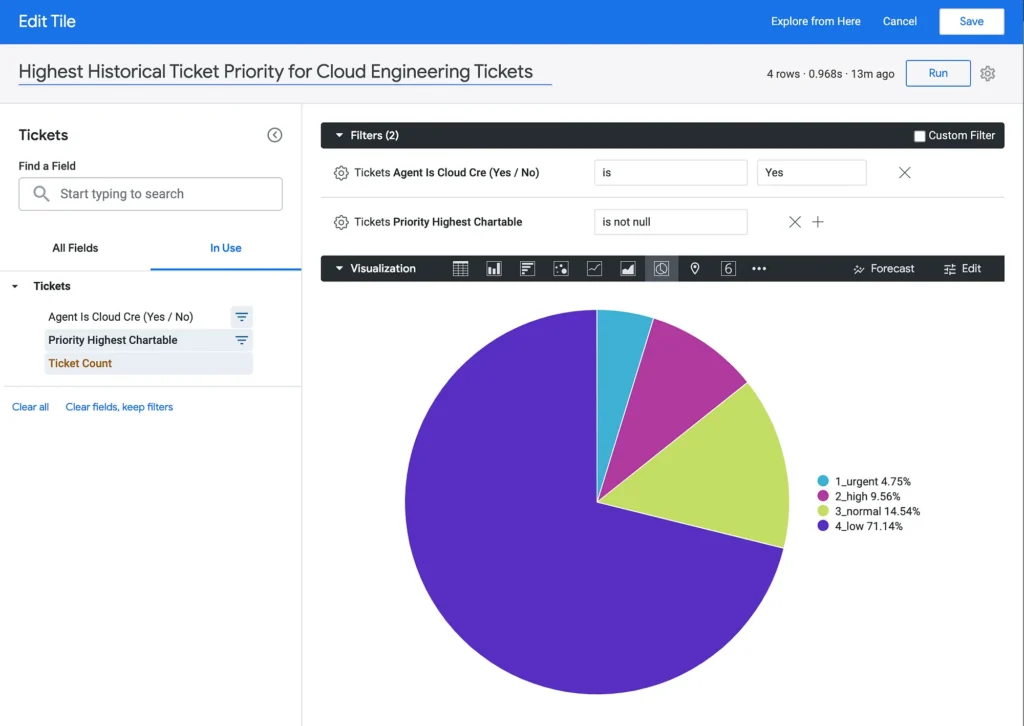
Let’s dive straight into another example. Assume a person in a leadership role is keen to understand the proportion each ticket priority represents out of the total tickets assigned to the engineering team. More precisely, they are interested in identifying the highest priority level that a ticket has reached during any stage of its lifecycle which is handled by engineers.
If we assume that the SQL from the tickets source above were made available within Looker, an end-user would simply do the following within Looker to answer this question:
- Choose the ‘Tickets’ dataset within Looker
- Click on the ‘Priority Highest Chartable’ dimension
- Click on the ‘Ticket Count’ measure
- Add a filter on the dimension “Agent is Cloud Cre Is Yes”
- Click the Pie Chart visualization and hit Run
Note the runtime in the upper-right corner. Due to hitting a data table created from Malloy-generated SQL, the query took less than 1s to execute:
Combine Looker’s end-user ease of use with its other modern features, such as the version control system that enables dev/prod dashboard deployment capabilities, as well as its advanced security settings enabling fine-tuned IAM permissions to dashboards and folders of dashboards, and it becomes clear why it is a great tool for enabling visualizations of data sources defined by Malloy code.
Data Consistency Is Key
As you integrate Malloy-generated SQL into Looker or your dashboarding tool of choice, you must remember one thing. The key to building a reliable, accessible data warehouse is this:
Do not grant access to raw data to your report-generating end-users!
Raw data access is the underlying cause of divergent and conflicting data powering reports created by different groups and departments. This is because engineers from each group — and often multiple engineers within the same group — inevitably pursue their own unique means of filtering, joining, and aggregating information.
Instead, only present tables backed by Malloy sources to report builders, such as Looker end-users. Malloy sources (and to some extent LookML as well) ideally will have already handled all common edge cases, filters, as well as complex joins and definitions for dimensions and aggregations. All of these complexities combined are unlikely to be fully dealt with correctly by individual report-builders, much less replicated consistently across multiple groups worth of analysts.
With a well-validated, collaboratively-designed set of Malloy sources presented as the only options to build off of within Looker, you ensure not only the highest quality data powers your analytics, you also ensure that when end-users from different groups build charts, their numbers will either match or very closely align to the numbers produced by charts made by others groups. It is important to have as much data complexity as possible handled behind the scenes before it can impact end users.
Current Limitations
While using Malloy and Looker together to design a scalable, reliable, and collaboratively developed data warehouse and reporting system has worked well at DoiT, it has a few (temporary) limitations. Namely:
- Malloy is a new programming language still in the early development stages. While I consider the language stable throughout my daily usage, you may still run into bugs for edge use cases. Oftentimes, the latest and greatest features are found on the pre-release channel of the VSCode plugin. Nonetheless, Malloy developers on the Malloy Slack channel are helpful, typically responding same-day to bug reports, feature requests, and debugging assistance.
- While Malloy does support BigQuery, Postgres, and DuckDB (and by extension CSV/TSV/Parquet formats and objects stored in buckets), it does not yet support other data warehousing platforms such as Redshift and Snowflake. Still, as this open-source project matures, it is hard to imagine that in pursuit of its mission to be “purpose-built for analyzing complex datasets” that the most popular data warehousing solutions would not eventually be supported.
- LookML, the language powering Looker, is a proprietary language that creates substantial adoption barriers originating from what I would consider poor documentation, insufficient walkthrough-centric learning materials, and ‘Contact sales to learn more’-style enterprise pricing. Even without Looker, Malloy can form the powerful foundation for less end-user-enabling yet more cost-effective BI tools such as Looker Studio.
Successfully design a scalable, collaboratively developed data warehouse and reporting system
I wish you luck with successfully integrating Malloy and Looker together to create a data foundation that better enables every tier of an organization to operate more effectively and reliably, and which restores some lost sanity to your data engineers, analysts, and C-suite team :)
Do you still have questions about utilizing the approach I’ve described within your organization to enable organization-wide data warehousing success?
Reach out to us at DoiT International. Staffed exclusively with senior engineering talent, we specialize in providing advanced cloud consulting architectural design and debugging advice — at no cost whatsoever.
If you are interested in deep-dive into other cloud data architecture topics, please check out my other blog posts on Medium and our DoiT International blog.