As the size and scope of cloud computing continues to grow, the need for cloud cost optimization methods is only going to get bigger and more important. Cloud spend is likely to account for over half of IT budgets in the next few years (with many digital natives already well beyond this percentage), with over half of that spend likely being devoted towards compute resources. This means that when business and finance leaders prioritize lowering their IT costs, compute is the area that represents the biggest opportunity for cost savings.
Automated solutions like DoiT Flexsave™ provide a simple and effective way to manage compute costs without taking on the risk or management challenges of purchasing your own compute reservations. This offers companies that may not have the capacity or need to adopt a wide-scale FinOps practice with a way to still get the benefits of cloud cost savings while they scale, and laying the groundwork for additional FinOps strategies down the road.
Unlike other solutions on the market, Flexsave provides far more than just reservation and commitment management. One of the most important aspects of a FinOps discipline is the ability to allocate costs and provide showback so that your cloud spend can be tracked across teams, environments, and applications. And as part of the wider DoiT technology suite, all Flexsave users also have access to DoiT’s powerful Cloud Analytics, which provide the ability to track costs and create reports that help contextualize cloud spend in alignment with wider business goals.
What kind of analytics are available within DoiT Cloud Navigator?
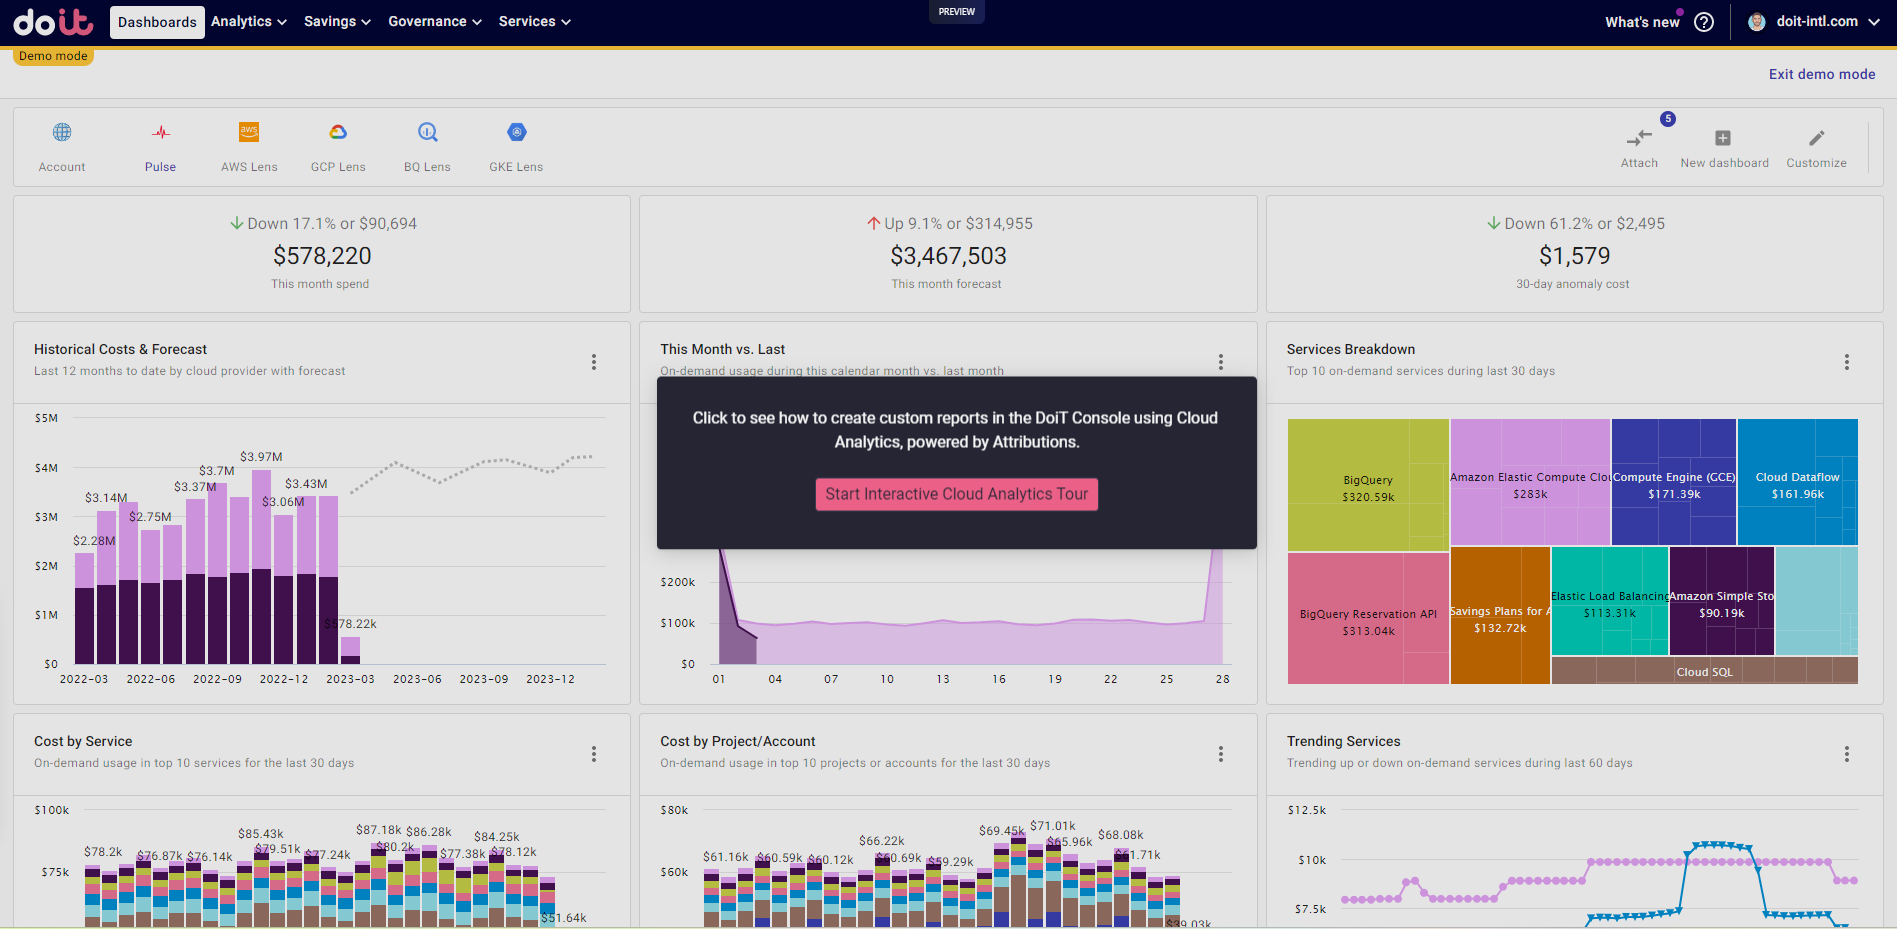
When users log into Cloud Navigator, they land on a default dashboard that is populated with out-of-the box reports designed to provide an at-a-glance view of your overall cloud usage and spend. For those users who deploy multicloud architectures, the default dashboard can incorporate all cloud spend, with the ability to change views between their AWS and Google Cloud environments.
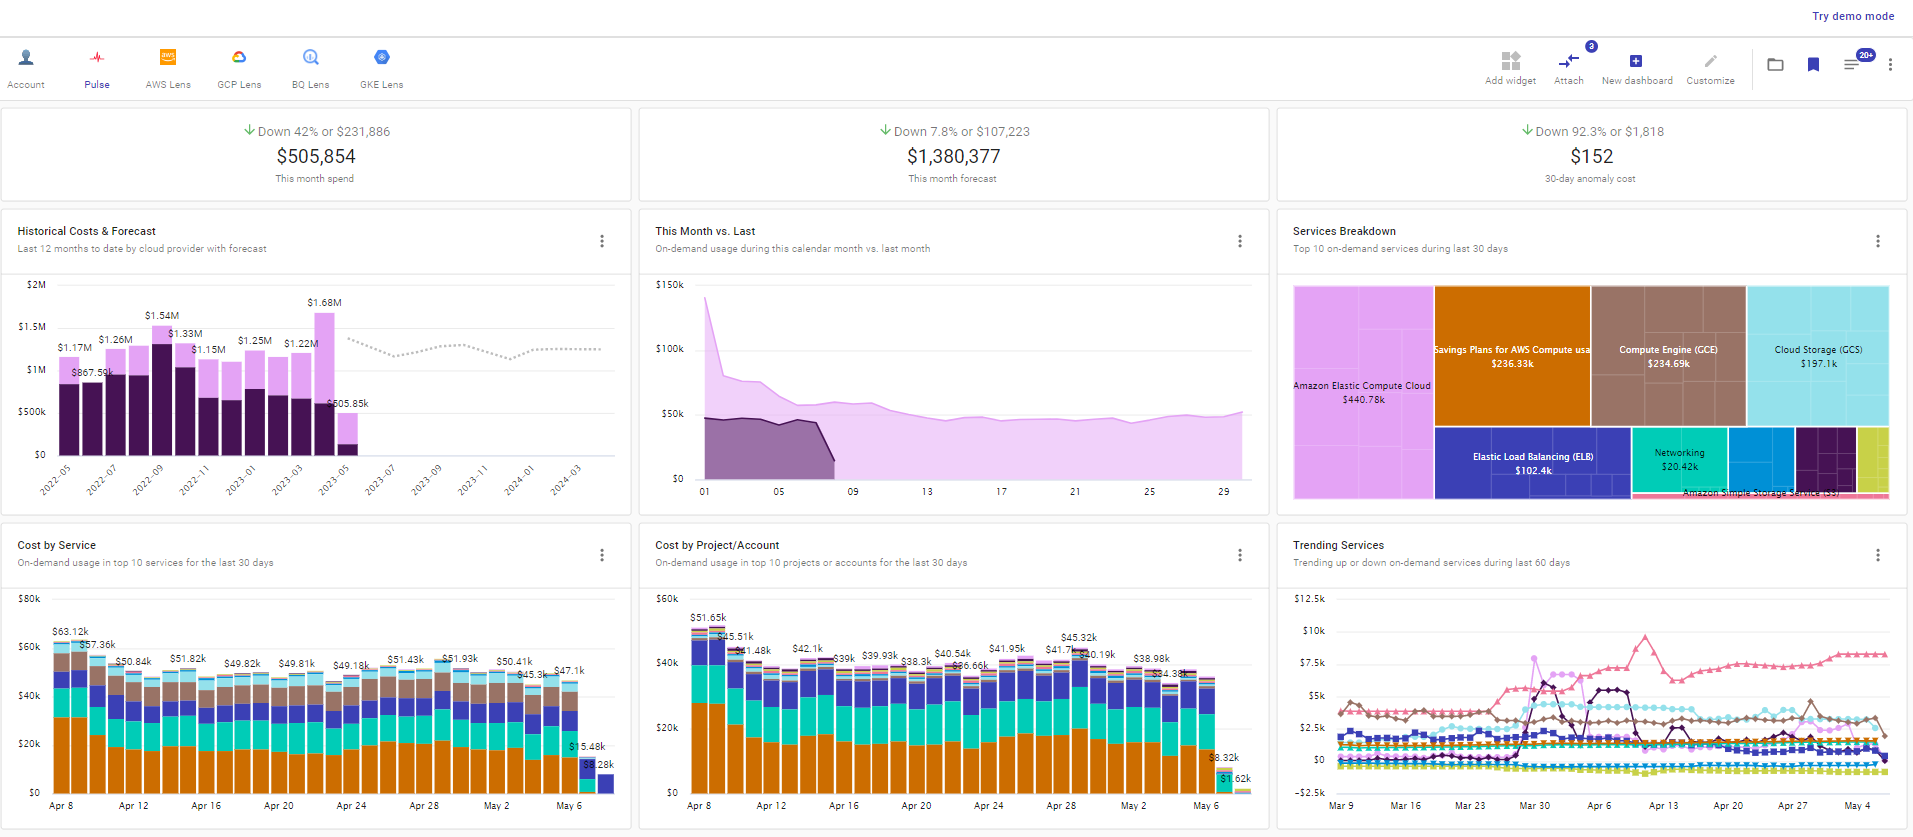
Each of these preset reports within the DoiT dashboard can be opened to view the data on a more granular level, or to modify the parameters of the report to view a different timeframe, change the visualization format, or drill down into specific data fields or metrics. Of the preset reports provided by DoiT, some of the ones that customers find to be the most helpful are a breakdown of the top 10 cloud services used in the last 30 days, costs by cloud service, and historical costs & forecast.
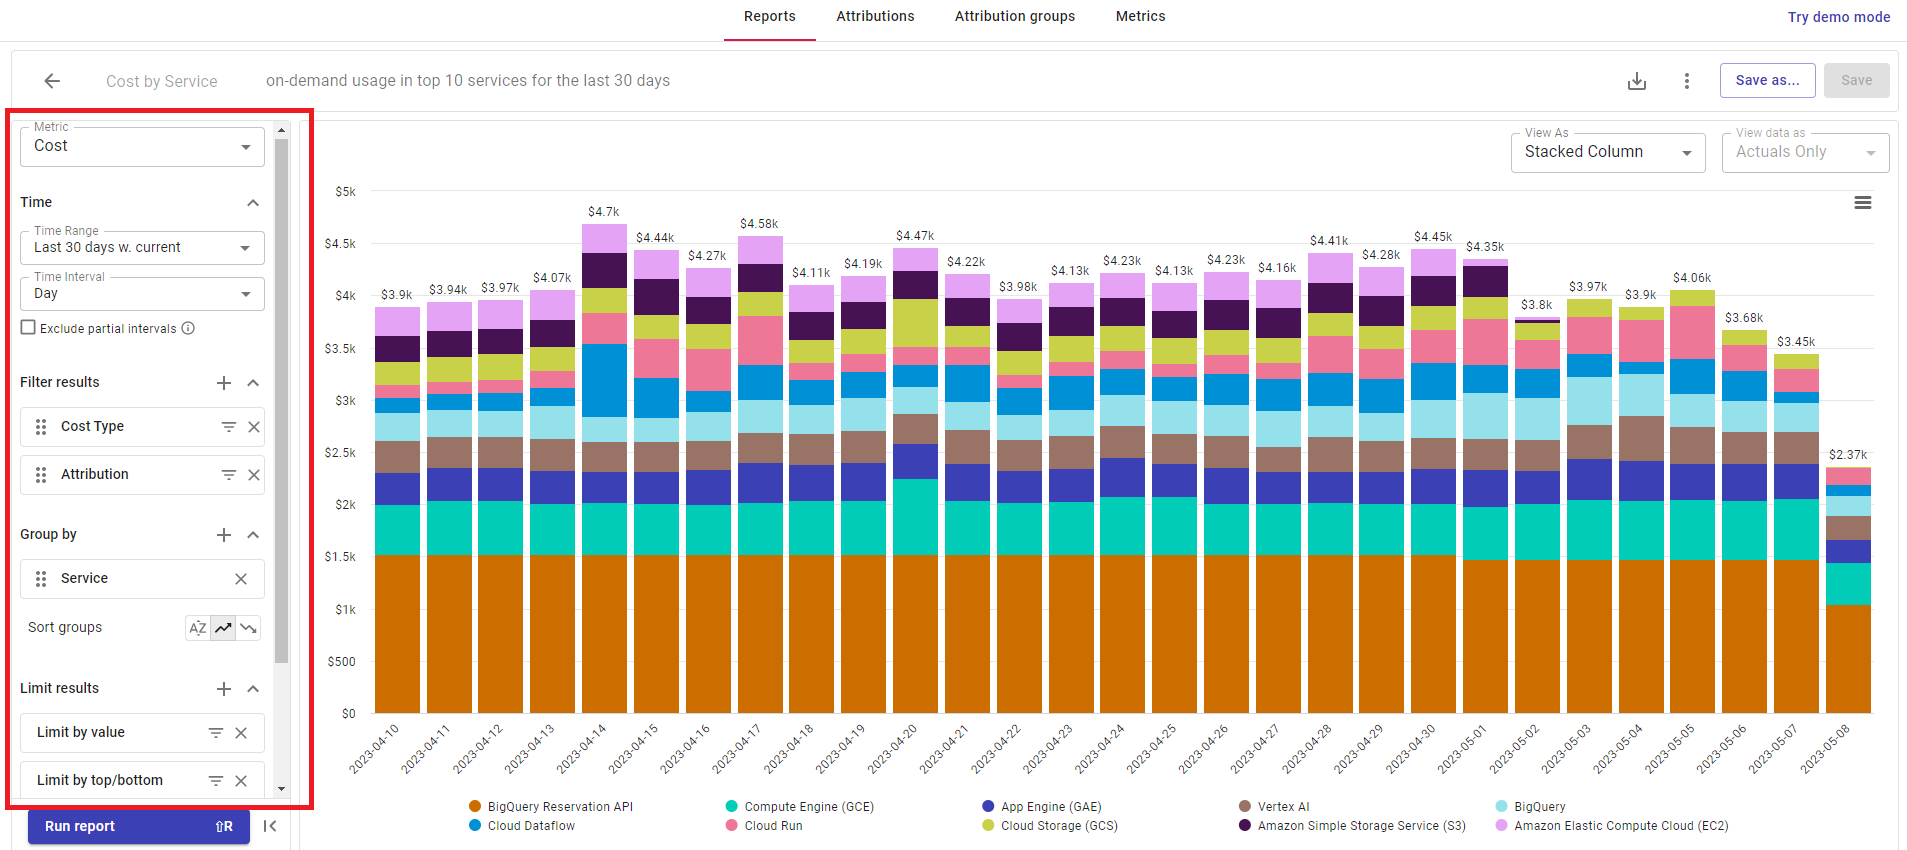
After clicking on an individual report to view it in more detail, the left-side toolbar allows you to slice and dice the data however you see fit. You can adjust the time period or interval, or filter by various fields like cloud provider, cost and service type, machine type, etc. After running the customized report, it can then be saved for easy access later on, shared with other members of your team, or added to one of your dashboards.
Taken together, these preset reports and dashboards, plus the ability to customize them to better fit your business needs, provides some of the most important tools for adopting wider FinOps principles throughout your organization.
Being able to break down costs and services and track these metrics across teams and applications can help drive cost accountability among organizational stakeholders, encouraging them to take ownership of their own costs and usage. From there, it becomes easier to operationalize the other key components of a mature FinOps model, namely the cost optimization along with continuous improvement.
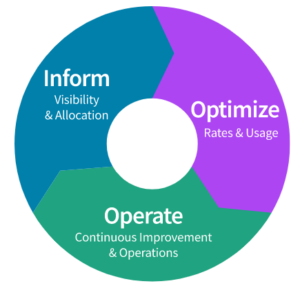
Source: FinOps Foundation
While the availability of DoiT’s preset reports provide Flexsave users with a powerful tool that goes well beyond the capacity of any simple reservation management solution on the market, they also have the ability to create custom reports that are wholly unique to their own environments and applications. This functionality is powered by Attributions, which serve as the foundation for all Cloud Analytics reports created by the DoiT platform.
What are Attributions?
As detailed in our previous blog, Attributions are logical groupings of cloud resources that define cost categories unique to your company. Using the tags and labels assigned to resources within your GCP and/or AWS environment, you can create Attributions to map costs to teams, applications, or environments (e.g. development environment, staging environment, etc.). You can even group resources across cloud providers if deploying a multicloud architecture strategy, which is a significant benefit when trying to do chargeback or showback for your whole organization.
In the example shown below, we have created an Attribution within our development organization that allows us to group resources both by individual engineering teams, and each environment within those teams. By pulling that Attribution into a new custom report, we can get a much better understanding of how these different teams are operating on a daily, weekly, or monthly basis by seeing how many resources they’re consuming over the course of those timeframes.
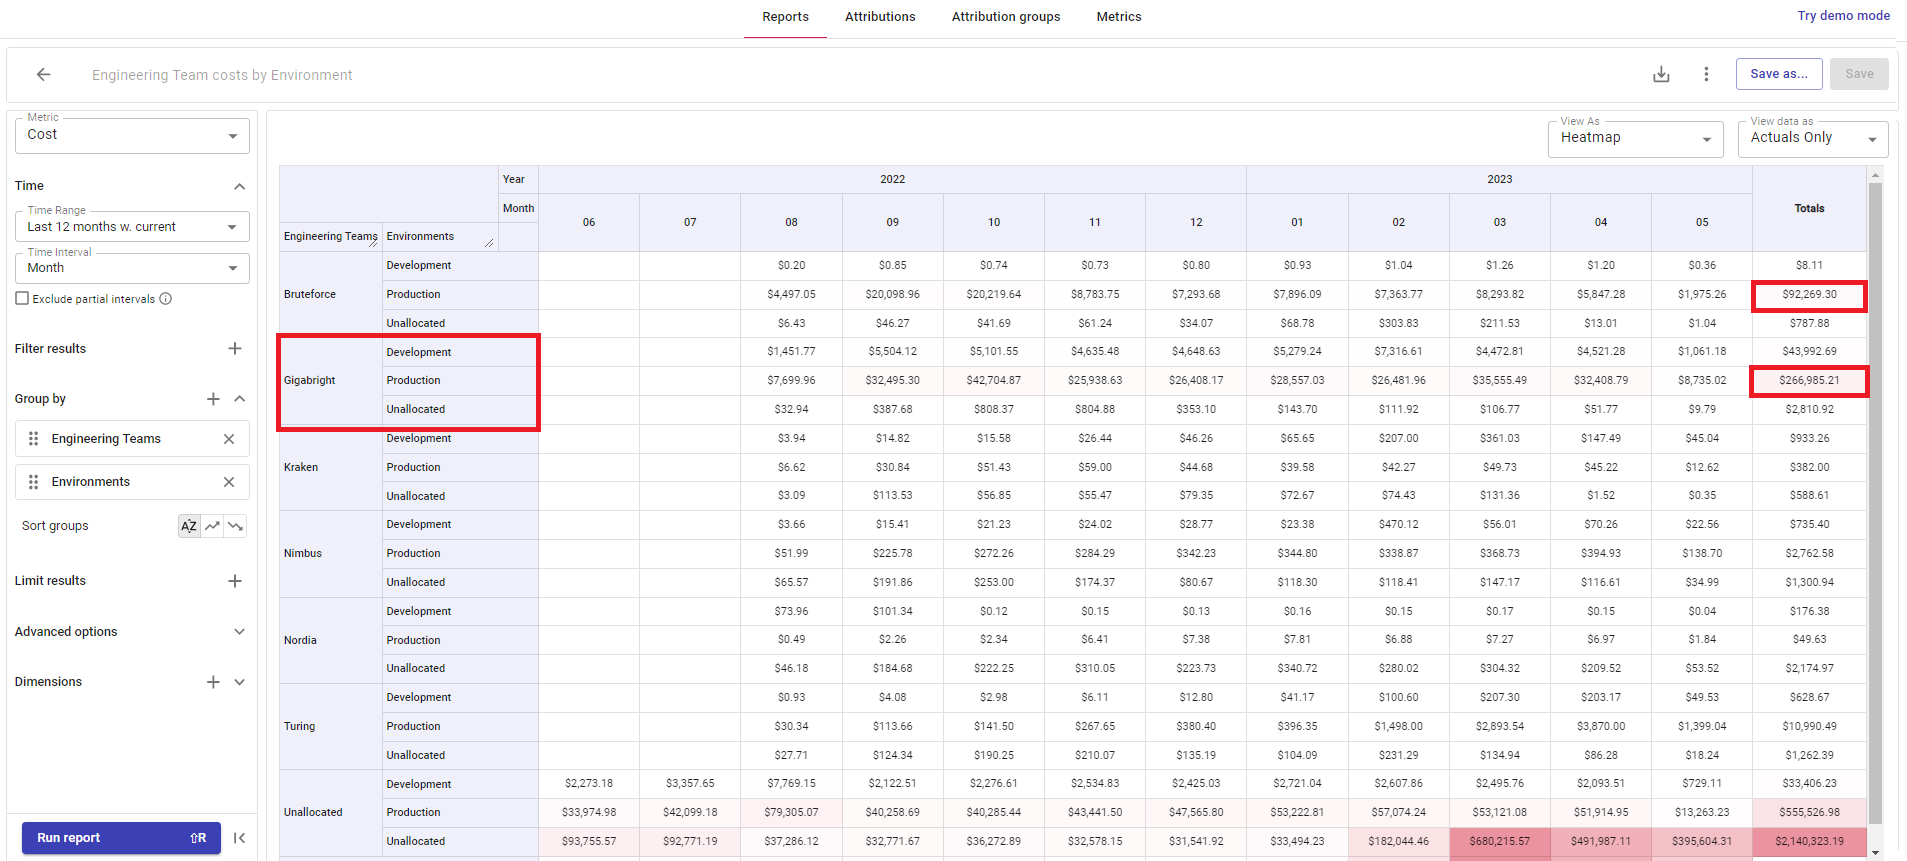
Using this method and the Heatmap visualization, we can quickly determine that the Gigabright engineering team is consuming the most resources within the organization, and within that team, the production environment commands the most usage.
Cost Optimization + Cloud Analytics
Given that the goal of a true FinOps motion is to help engineering, finance, technology, and business teams collaborate on data-driven spending decisions, it goes without saying that as you provide these teams with more data and context for cloud usage, the more informed they can be when making those decisions.
And when you combine that capability with built-in cost optimization methods like those provided by Flexsave, you’re suddenly well on your way to having a fully optimized and efficient cloud architecture that will do wonders for your overall business objectives.
To get a better understanding of how these features work within the DoiT Console, you can check out our recent webinar on the topic, or click the image below to take an interactive tour of DoiT’s Cloud Analytics feature.