Photo by Rob Wicks on Unsplash
Preface
The BigQuery editions exposed customers to new pricing models and relatively significant updates to existing models.
At DoiT, we work with many customers to build well-architected systems, efficiently use cloud services, and optimize costs. Due to the BigQuery changes, customers were reaching out to reduce computing costs and considering the transition from ‘On demand’ to a new pricing model, the ‘Standard Edition’.
The following will guide you through steps to determine whether it’s cost-beneficial to do a transition and how to perform and monitor it.
The SQL code referenced in the post requires access to these INFORMATION_SCHEMA views: JOBS_BY_PROJECT, JOBS_TIMELINE_BY_PROJECT, RESERVATION_CHANGES_BY_PROJECT.
Prerequisites for table access:roles/bigquery.resourceViewer(project level)
The core of the Standard Edition reservation
The Standard Edition, a compute-based (Slot hours) offering, stands out among other compute-based pricing options because it’s project-based (similar to On-Demand) instead of organization-wide.
Its primary benefit is access to the autoscaling feature at a low cost and without any commitment: “BigQuery dynamically adjusts your slots based on the increase or decrease in your workload.” ( Introduction to slots autoscaling )
The key contrasts between On-Demand and Standard Edition include:
1. Pricing units: On-Demand charges according to data scanned, whereas the Standard Edition uses a slot/hour model.
2. Slot availability: With On-Demand, slots are considered “hot” and instantly accessible, while in the Standard Edition, the AutoScaler identifies the necessary slot capacity for query jobs before assigning slots (10~ seconds delay), which affects query latency.
3. Maximum available slots: For On-Demand, there are 2000 slots, and for the Standard Edition, 1600 slots.
\[1\] Checklist of standard features and limitations
The first step involves verifying your project compatibility with the Standard edition. Take a close look at the noted features list, and make sure you grasp the abilities and restrictions:
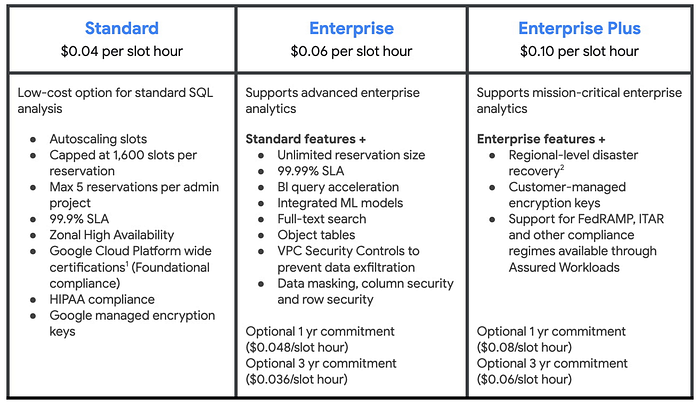
A complete detailed comparison exists here: BigQuery editions features.
\[2\] Analyze workload usage.
Once you’ve examined the features and constraints, the subsequent step involves estimating expenses based on whether your project is I/O-focused or CPU-focused (Slot). In the INFORMATION_SCHEMA.JOBS view, you can obtain this data from total_bytes_billed(I/O) and total_slot_ms (CPU) .
Our objective is to contrast the expenditure for scanned data with the approximated expenditure for slot usage. Calculating the I/O-based spend is relatively simple, as it’s the sum of all query costs. However, the slot-based expense estimation is a bit low since it doesn’t consider autoscaler behavior (100 slot bucket size and downscaling after a one-minute minimum). We’ll apply a 1.5 multiplier to the slot-based evaluation to address this discrepancy.
The table below compares the monthly costs with the ratio of Slot cost to On-demand, indicating the estimated cost change when transitioning from On-demand to Standard edition.
A ratio value below 100 suggests a potential cost reduction, while a value above 100 signifies a possible increase in cost.
For Example:
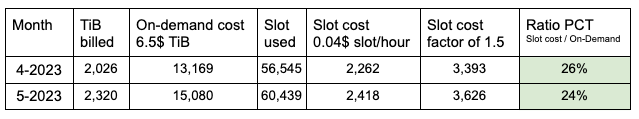
Customer monthly spend — On-demand is more expensive
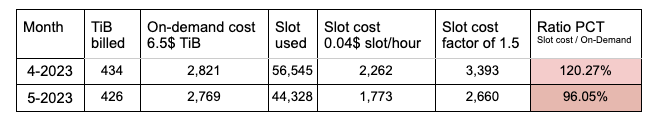
customer monthly spend — On-demand is cheaper
Code to create the above table: BigQuery OnDemand vs. SE.sql
Considering that the Standard Edition has fewer features than the On-demand edition, it’s recommended to stick with the On-demand option if the ratio is generally over 75%. This is because the anticipated savings will likely be minimal while sacrificing some functionality.
\[3\] Max slots configuration
The Standard edition needs a single configuration, the maximum slot configuration, which acts as the upper limit for AutoScaling.
How can the appropriate configuration be determined?
Unfortunately, there isn’t a one-size-fits-all solution, as the parameter will likely need some adjustment after the initial setup, depending on your workload pattern and how you want to balance cost and performance.
One way to calculate an initial value is by using this formula:
Determine the 90th percentile hour during the selected period when the slot usage exceeded 100 (basic setup), and round it up to the nearest multiple of 100.
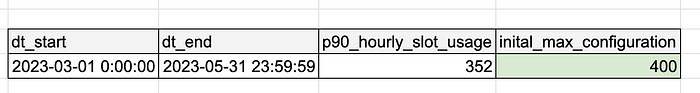
Max configuration based on the P90 hour in the selected period
Example code snippet for determining the initial maximum configuration: BQ SE max configuration.sql
Create reservation
A step-by-step guide for creating a reservation is well documented here: Get started with reservations.
Choose Standard Edition, set ‘max Slots’ and choose the appropriate region or multi-region, as the reservation will not function properly.
\[4\] Monitoring Performance and cost evaluation
Performance impact
To track your app's performance, gather metrics like job processing times and ad-hoc query response times before migration and compare them with the post-migration results. It’s a good idea to inform BigQuery users about anticipated changes and collect their opinion.
You can evaluate the performance from a system standpoint by referring to the Administrative resource charts discussed in the following section.
Cost Benefits
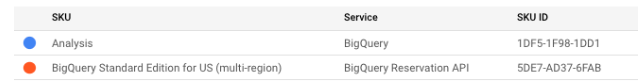
To evaluate the cost-effectiveness, review your expenses using the daily billing dashboard. Choose the Analysis and Standard Edition SKU from there in the billing section.
The table below sums in a one-hour interval the total slots allocation abs the estimated costs. Using this information, you can roughly calculate the actual cost based on the autoscaler’s actions.
Example code snippet: Standard Edition cost estimation.sql
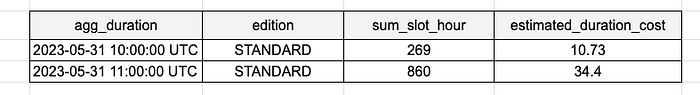
Estimated cost distribution per hour
\[5\] Tunning on
Adjusting the settings of the Standard Edition involves modifying the maximum slot configuration to either enhance performance (by increasing slots) or lower expenses (by decreasing slots). The goal is a well-balanced system, ensuring resources aren’t underused or over-allocated.
Monitoring your workload’s efficiency will demonstrate whether the system is balanced, underutilized, or over-provisioned. You can achieve this by observing the Administrative resource charts or by direct query theINFORMATION_SCHMEA views.
Administrative resource charts:
BigQuery admins monitor their organization’s usage of Slots and the performance of BigQuery jobs over time. You can find these charts in the ‘Monitoring’ section of the BigQuery sidebar, which offers various views to address different inquiries. To get acquainted with these functionalities, refer to the guide on administrative resource charts.
- Slot usage analysis: Utilize the P90 or P99 metric to examine the relationship between slot usage and allocation (which includes “baseline + Autoscaled slots”) and the duration required for scaling up or down.
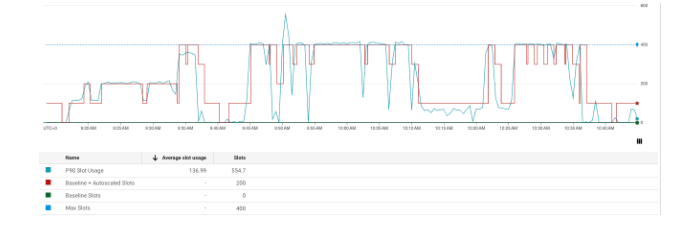
Slot Usage
The above graph utilizes data from the RESERVATION_CHANGES_BY_PROJECT``view, which contains information about reservation modifications.
The table below displays the slot allocation and the duration until the next change (scaling up or down) occurs. The metric 'allocated_slots' represents the quantity of slots assigned at a particular moment until a new 'UPDATE' occurs, while the 'Estimated total slots' represents the overall allocation throughout the period.
Example code snippet: Monitor BQ edition autoscaling.sql
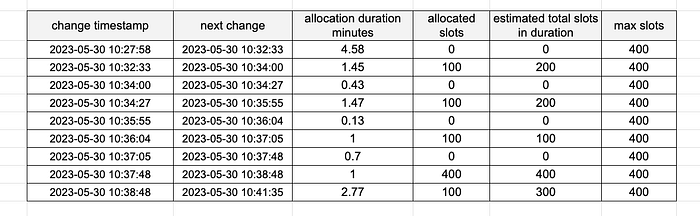
Actual slot allocations with duration
- Job concurrency: To understand system bottlenecks, look at the ‘pending jobs’ metric.
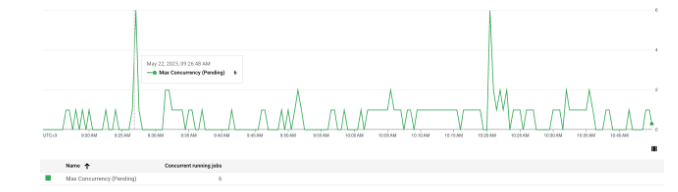
Pending Jobs
- Job performance: Monitor jobs experiencing high latency by utilizing the 90th percentile (P90) measure

Jobs latency
Summary and Recommendation
In cases with bursts or spikes, there may be more suitable approaches than this, necessitating further scrutiny. Nonetheless, the tools can provide valuable insights throughout the analysis.
The transition primarily hinges on the type of usage by users in the specific projects, such as I/O-focused (making ‘On-demand’ more expensive) or CPU-focused (resulting in a higher cost for ‘Standard Edition’).
Google primarily recommends the Standard Edition for research and development projects, stating, “For instance, the Standard Edition is ideal for ad-hoc, development, and testing workloads.”
Since the term ‘production workload’ can vary among customers, some customers may consider using the Standard Edition even for ETL/ELT production workloads. This would be acceptable if the edition’s limitations are met (especially the 99.9 SLA), the load remains stable over time, and no end-users are worried about query latency.
Now that you’re familiar with this process try it and let us know how it goes.