Introduction
Data visualization is a critical aspect of DoiT Console Analytics, and we rely heavily on charts to help our users decipher complex data. As our clients’ demands for larger data sets in their charts increased, our existing charting library, Highcharts, began to falter, causing UI freezes and negatively impacting user experience.
Recognizing the need to address these growing demands, we embarked on a search for an alternative charting library that could efficiently manage large data sets while maintaining the performance and functionality our users expected from us.
In this blog post, we share our journey and experience in transitioning from an SVG-based charting library to a canvas-based one, highlighting the challenges and benefits of each approach.
The Challenges of SVG-Based Charting with Large Data Sets
Scalable Vector Graphics (SVG) has been a widely favored choice for charting and data visualization. However, when handling larger data sets, SVG-based libraries can present significant performance bottlenecks. The root of this issue lies in how SVG libraries manage chart elements.
With each element represented by a DOM node, the more elements in a chart, the larger the DOM grows. Consequently, JavaScript needs help navigating large DOM trees efficiently, leading to UI freezes and other user experience issues.
As an Example: A simple report like this creates 10000+ DOM nodes.
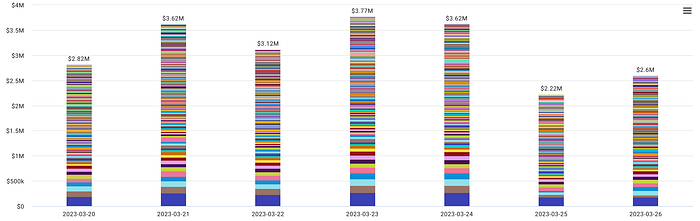
Simple Analytics Chart
If we inspect a single chart bar in the browser, we can see that each bar is represented by a single
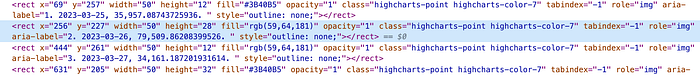
Chart Structure in DOM
The Benefits of a Canvas-Based Approach for Large Data Set Charting
Canvas is a web technology providing a drawing area on a web page and allows for the creation and manipulation of graphical objects using JavaScript. As a bitmap-based drawing technology, it renders content directly on the canvas element, resulting in a single DOM node.
This makes it an excellent choice for dynamic, interactive graphics and complex visualizations. Moreover, by leveraging the GPU, Canvas can produce smoother, more responsive charts, providing a more engaging and user-friendly experience.
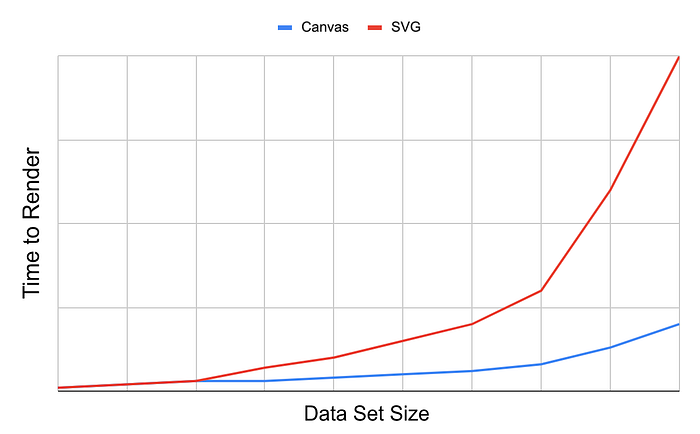
Comparing the Render Time of SVG vs. Canvas
Comparing Libraries and Choosing the Best Fit
With numerous canvas-based libraries available, choosing the best one can be a daunting task. We approached this challenge by testing various libraries with large data sets and evaluating their performance, features, documentation, popularity, and flexibility. After extensive analysis, we selected Apache ECharts as the ideal library for our project due to its exceptional performance, customization options, and strong community support.
Integrating the New Library and Analyzing Results
We integrated Apache ECharts in incremental steps, beginning by allowing new charts to work alongside the old library for gradual migration. This approach minimized the risk of errors and ensured the new charts met our requirements. Once implemented, we compared the performance of the new library with the old one using real production data, allowing us to measure the improvements in performance and efficiency.
Example: Performance improvement using real production data to generate a very large report.
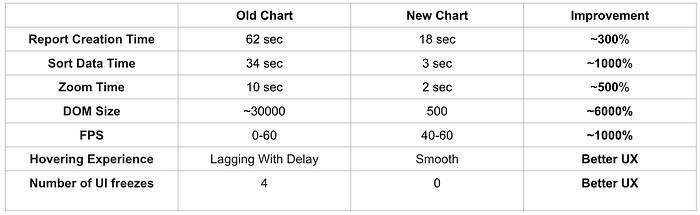
Old vs. New charting experience
Summary and Conclusion
The process of transitioning from an SVG-based charting library to a canvas-based one proved challenging but ultimately rewarding. Our previous library could not cope with our clients’ increasing demands for larger data sets, causing performance issues. Through thorough research and testing, we found Apache ECharts to be the best solution. The gradual integration of the new library resulted in a smooth transition and significant performance improvements. The new library delivers a more visually appealing and interactive user experience, even with large amounts of data, meeting and exceeding our client’s expectations.