
Google Cloud Logging charges $0.5/GiB of ingested logs with a free tier of 50 GiB per project. While it usually sums up to a small amount, there are cases that can cause these costs to spike. While Google has been quite forgiving in such cases and issues refunds, you better have this under your control in case their lenient policy changes.
Why would logging costs spike?
We’ve seen this happen many times — a developer deploys a new version with extra debugging verbosity. Or they create a new HTTP load balancer without disabling the default configuration of streaming its access logs. Next thing you know, your Logging usage increases 100x with costs increasing at a similar pace.
If you’re actively monitoring project costs, you‘ll likely identify this spike in Logging costs within a couple of days. But others might be less fortunate, resulting in the all-too-familiar phenomenon of bill shock.
We at DoiT International eliminate this spike-induced bill shock altogether by sending our customers ML-based cost anomaly alerts in real-time, as the abnormal behavior arises.
How to evaluate logs ingestion rate
Like almost any other Google Cloud service, Logging produces some valuable metrics that are available in the Monitoring service.
The metric to look at to start with is “Log bytes ingested”.
Here’s an example chart of this metric:
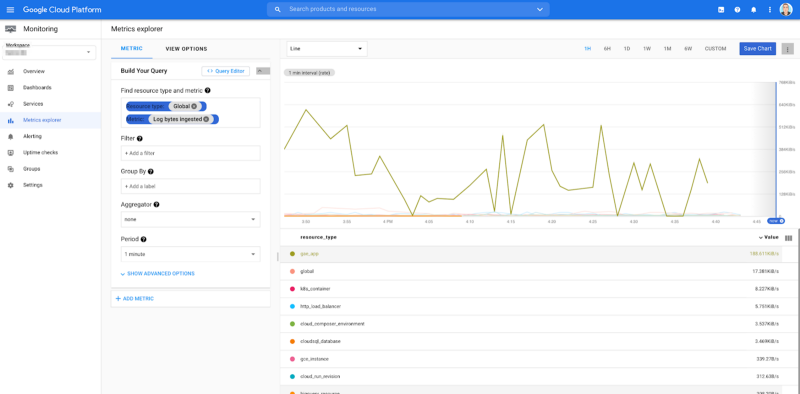
Looking at the last 1-hour period, there’s no pattern revealed and so it’s hard to detect any anomalies.
If we expand the time range to a one-month period, we’re able to see that there’s a clear pattern of logs getting produced extensively during weekdays (Monday — Friday):
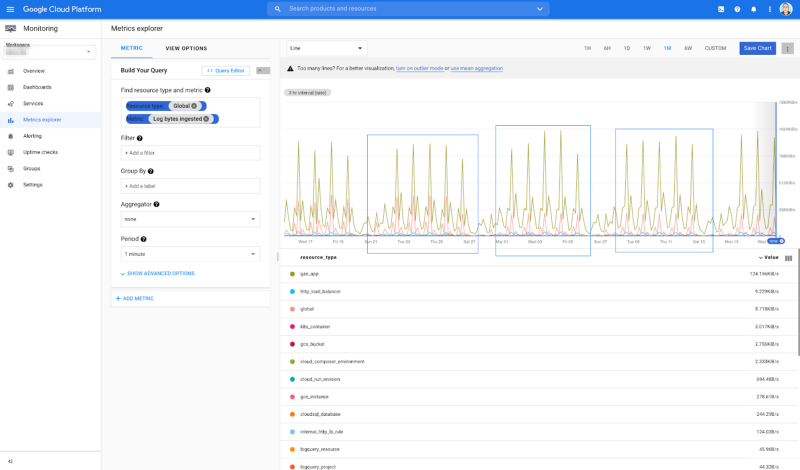
This is a pattern we can inspect, and if any of the time series breaks it, we know we might have a problem that causes extensive log emissions in the related service.
How to dig deeper into log metrics
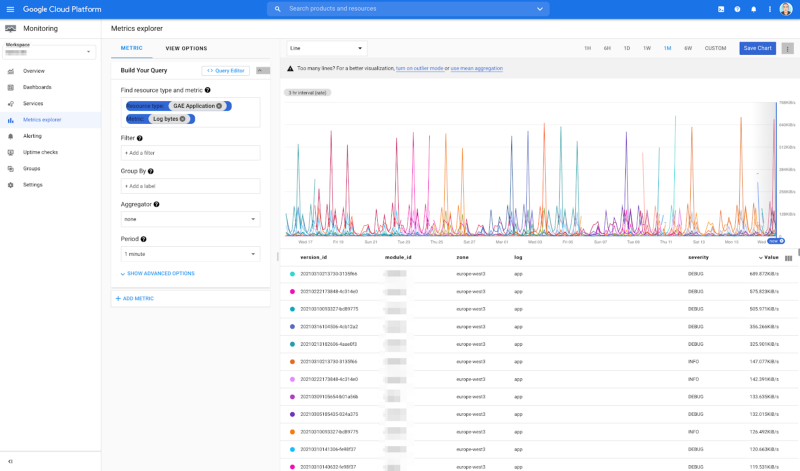
All GCP resources emit the “Log bytes” metric so, for example, if we wanted to break out App Engine’s log emission rate, we could plot this chart:
An analysis is nice, but how about monitoring this?
As you can guess, no one wants to sit and stare at a chart all day, waiting for an anomaly to pop. So how can you proactively monitor the log emission rate?
If the log emission rate is constant throughout the day, you can simply create a Monitoring alerting policy. This will alert whenever a time series increases its value by a configured percentage.
On the other hand, if log emission is cyclical, monitoring gets a bit harder. Logs emission fluctuates during the day, so a time series increase/decrease is expected. As a result, setting an alert based on it can be a cause for a lot of false alarms.
To get around this, you can smooth the seasonality by modifying the aggregation period.
Ignoring time-series seasonality
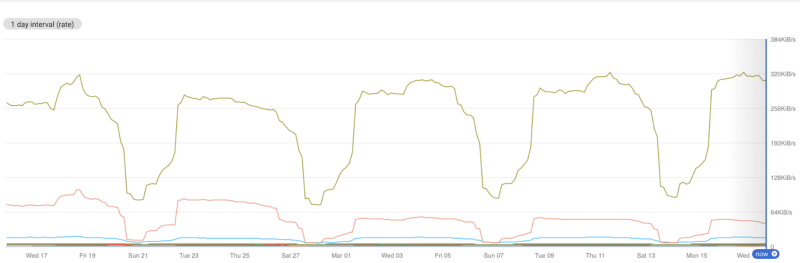
We can smooth the plotted data by aggregating over a longer period of time, so for example, the chart that looked like this with a one-minute aggregation period:
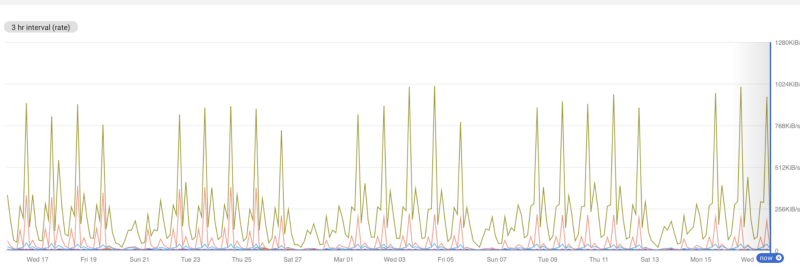
…will look like this, when the aggregation period is set to one day:
…and like this when the aggregation period is set to one week:
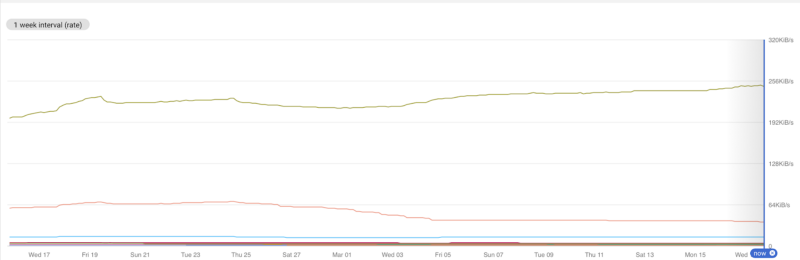
The last chart is definitely something we can alert on when any of the time series increases (or decreases) by a certain percentage.
Unfortunately, Google Cloud Monitoring doesn’t currently support aggregation periods that are longer than 25 hours for Alerting Policies, so you cannot construct such an alert from Cloud Monitoring.
We’ve reached out to Google to suggest removing the 25 hours limitation so you can properly alert on Logs emission when the time series are cyclical. A feature request was submitted, you can star it if you are interested in this functionality.
Thanks for reading! To stay connected, follow us on the DoiT Engineering Blog, DoiT Linkedin Channel, and DoiT Twitter Channel. To explore career opportunities, visit https://careers.doit.com.