
We have created an open source project to export Google Cloud Monitoring data to BigQuery for better control and analysis.
Cloud Monitoring is one of the most effective ways to track Google Cloud computing service metrics. Every Google Cloud service has its own metrics, with unique data points that are usually represented in dashboards. Unfortunately, this vital data is retained for limited time periods.
Cloud Monitoring acquires metric data and holds it for pre-defined periods of time. These time periods vary according to the metric type. See Data Retention for more details. Google keeps updating these time periods. It may be a good idea to re-visit this page from time to time.
At the end of the time period, Cloud Monitoring deletes the expired data points. When all the points in a time series have expired, Cloud Monitoring deletes the time series. Deleted time series don’t appear in Cloud Monitoring charts, nor do they show up in results from the Monitoring API.
In short, data points are deleted after 6 weeks. But this can be valuable data that we would like to investigate even beyond that time frame for analytical and troubleshooting purposes. As of now, there is no simple option to export large amounts of monitoring data to other analytical systems.
The good news is that we have created an OS project that exports raw data from Cloud Monitoring to a BigQuery table for future analysis!
Click here to access the project:
https://github.com/doitintl/gcp-monitoring-metric-exporter
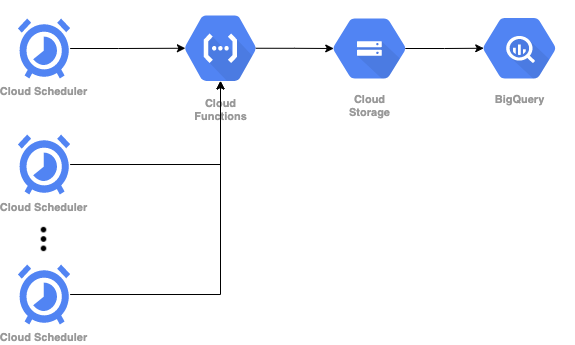
For example, let’s export a Google Cloud Dataflow system lag metric (dataflow.googleapis.com/job/system_lag) into a BigQuery table.
This data is currently available in Cloud Monitoring, as shown below:
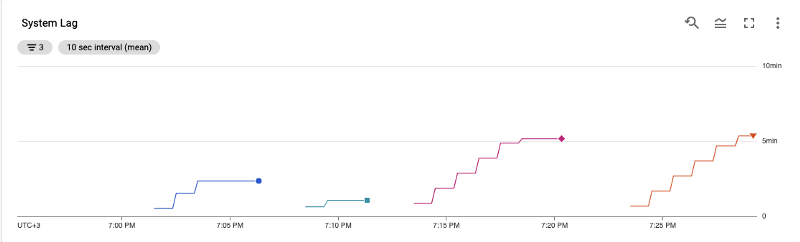
We would like to export this data to BigQuery, where we can retain it for a longer period of time to aggregate and analyze it properly.
Click here to get started:
https://github.com/doitintl/gcp-monitoring-metric-exporter
Always make sure that you are configuring the Filter with a valid filter expression value. In this specific case, it should look like this:
‘metric.type = “dataflow.googleapis.com/job/system_lag”’
Also, notice the pattern of a single quote (‘) on the outer part of the filter and double quote (“) inside the filter.
After running the GCP Monitoring Metric Exporter under the relevant BigQuery dataset, we get a new table with the name of the export job, configured with the metric data points. GCP Monitoring Metric Exporter will keep exporting and updating the table with the relevant data.
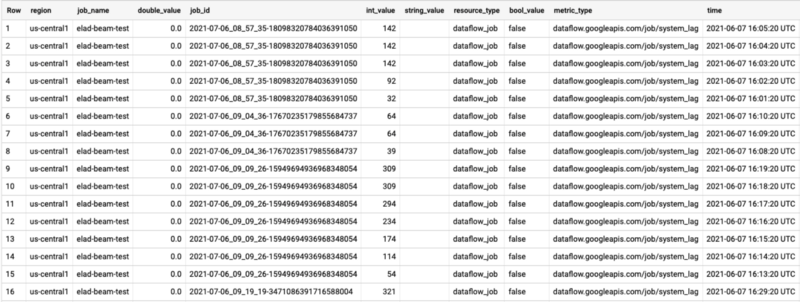
Now that we have the Metric data in BigQuery, we can easily use all proven and tested BigQuery features to explore, analyze, and share the data with all relevant stakeholders. More importantly, we can also retain this data for as long as required, without worrying about Data Retention time periods.
Please feel free to share this resource with your colleagues and social media contacts. Also, let us know if you have any feedback or suggestions.
Thanks for reading! To stay connected, follow us on the DoiT Engineering Blog, DoiT Linkedin Channel, and DoiT Twitter Channel. To explore career opportunities, visit https://careers.doit.com.