Cloud Dataproc is an amazingly fast to provision, easy-to-use, fully-managed cloud service for running Apache Spark and Apache Hadoop clusters in a simple and very cost-efficient way. Operations that used to take hours or days take seconds or minutes instead, and you pay only for the resources you use with per-second precision billing.
You can resize Google Cloud Dataproc clusters at any time — from three to hundreds of nodes — so you don’t have to worry about your data pipelines outgrowing your cluster’s resources. Once the cluster is up, you can scale it up or down manually.
However, if your workloads isn’t constant in regards of amount of resources it needs over time, you will need to monitor your cluster and to decide whether you need to manually add more workers or remove some workers from the cluster. Plus you usually want some of the these workers to run as preemptible instances to help you to optimize your compute costs.
Here comes Shamash to the rescue. Shamash is an open source auto-scaling system that can monitor and scale multiple Google Dataproc clusters within a single project.

Shamash was the god of justice in Babylonia and Assyria, just like the Shamash auto-scaler whose job is to maintain a tradeoff between costs and performance.
We had a few requirements from Shamash
- Run serverless to reduce management burden
- Support multiple clusters, each with its own autoscaling configuration
- Work with standard Dataproc images and clusters
- Support preemptible workers to reduce operational cost
- Low operational cost of Shamash itself
We decided to build Shamash and run it on Google App Engine, Standard Environment. This alone helped us to achieve two of the requirements:
- Serverless operation by using App Engine. We don’t have to manage our servers, and we get high availability and scalability out of the box.
- All the data that we used and all the operations that we are performing to the cluster are available by the DataProc API. Each monitored cluster has it’s own configuration data stored in Google Datastore (managed NoSQL database)
- Low operational cost — due to the pricing model of App Engine and to the fact that Shamash “awakes” once every 2 minutes and in the rest of the time it doesn’t consume any resources and therefore keeping the price very low.
To do the actual autoscaling, we decided to work with two Dataproc metrics which are available out of the box:
- YARNMemoryAvailablePercentage — The percentage of remaining memory in the cluster available to YARN.
- ContainerPendingRatio — The ratio of pending YARN containers to containers allocated
Shamash was written in Python (using flask & flask-admin) and it uses some additional Google Cloud Platform services:
- Cloud Pub/Sub
- Stackdriver Monitoring
- Cloud Datastore
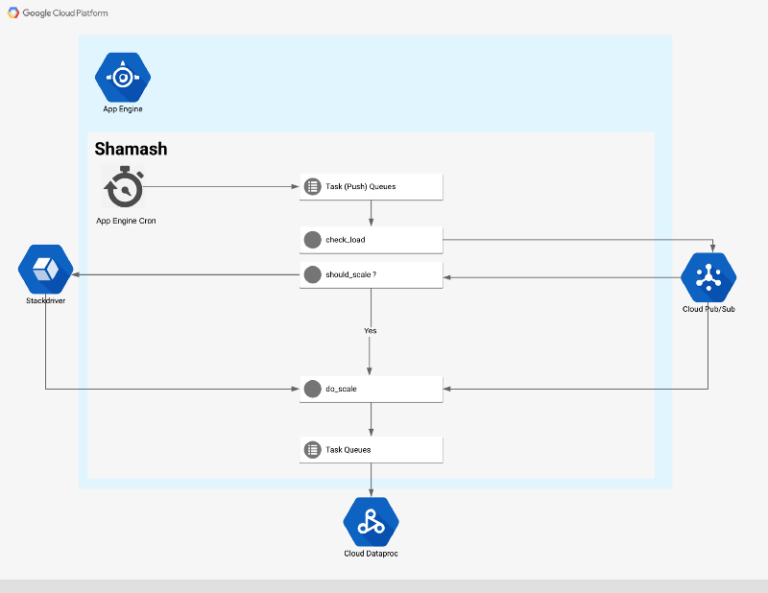
Shamash High-Level Architecture
Flow
The entry point to the autoscaling flow is a cron job that runs every 5 minutes (configurable via cron.yaml)
The cron job calls a web endpoint creating a monitoring task for each cluster that Shamash is monitoring:
The monitoring task retrieves the data from the cluster via Dataproc API and publishes it to a Pub/Sub topic. Once there is a new message in the topic, the Pub/Sub service invokes a function which performs two tasks:
- Write all the metrics from the cluster to Stackdriver as a time series data
- Checks the metrics against autoscaling rules and decides whether we need to scale the cluster (up or down). If the cluster has to be scaled, then a message will be published to another Pub/Sub topic.
The scaling task will try to predict how many nodes it needs to add or remove from the cluster. If the cluster doesn’t have enough memory left or it doesn’t use any memory at all, we can apply some heuristics analysis and calculate a new number of nodes
If we have enough historical data stored in Stackdriver, Shamash will try to predict how many new nodes should be added to the cluster.
After some boundary and sanity checking, we will patch the cluster with the new number of nodes. In case of a scale down event, Shamash would never remove nodes from the cluster if there are pending YARN containers.
Configuration
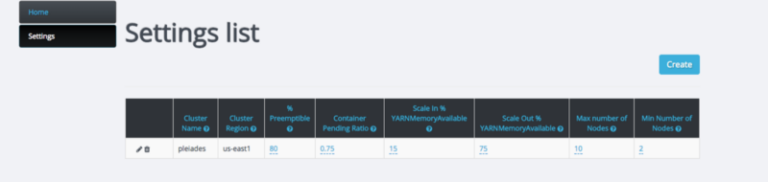
To configure new Google Cloud Dataproc cluster with Shamash, you will need to configure the following settings:
- Cluster — Google Dataproc Cluster Name
- Region — Cluster Region
- PreemptiblePct — The ratio of preemptible workers in Dataproc cluster
- ContainerPendingRatio — The ratio of pending containers allocated to trigger a scale out event of the cluster. (UpContainerPendingRatio = yarn-containers-pending / yarn-containers-allocated). If yarn-containers-allocated = 0, then ContainerPendingRatio = yarn-containers-pending.
- UpYARNMemAvailPct — The percentage of remaining memory available to YARN to trigger scale up of the cluster.
- DownYARNMemAvailePct — The percentage of remaining memory available to YARN to trigger scale down
- MinInstances - The least number of workers the cluster will contain, even if the target is not met
- MaxInstances — The largest number of workers allowed, even if the target is exceeded
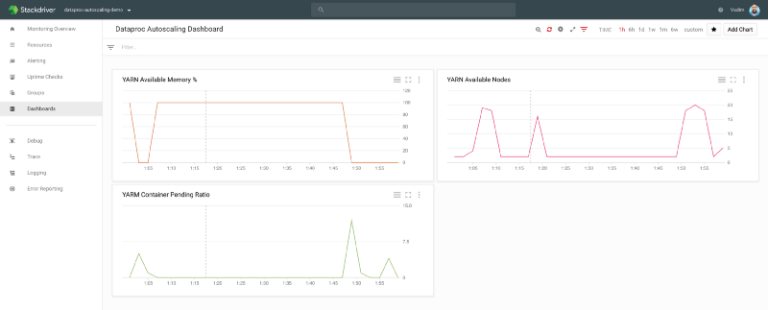
Visualization
We didn’t build any visualization into Shamash, however, since all metrics are reported to Stackdriver, you can build a dashboard that will show you the metrics which Shamash is tracking, as well as the number of nodes, number of workers and preemptible workers.
To test Shamash, I have exported one of the BigQuery’s sample datasets, specifically Wiki1B to Google Cloud Storage bucket and created a HIVE table by running:
CREATE EXTERNAL TABLE wiki (year INT, month INT, day INT, wikimedia_project STRING, language STRING, title STRING, views INT)
ROW FORMAT DELIMITED FIELDS TERMINATED BY ‘,’
LOCATION ‘gs://hive-store/’;
Once the table is created, I executed the following query as a HIVE job:
gcloud dataproc jobs submit hive --region us-central1 --cluster cluster-4806 --execute="SELECT year, language, count(language) as counter FROM wiki group by year, language order by year, counter DESC;" --async
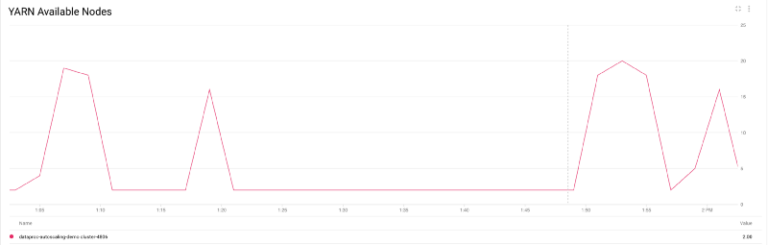
By looking at the Stackdriver, you can monitor the number of Dataproc nodes going up and down as the job finishes:
More specifically, you can see number of YARN nodes going from just 2 to almost 20 nodes, while 80% of them are being preemptible (as configured in my policy) and then scaling down back to 2 when the jobs are finished.
We can also verify the results by looking over the CPU utilization of the cluster:
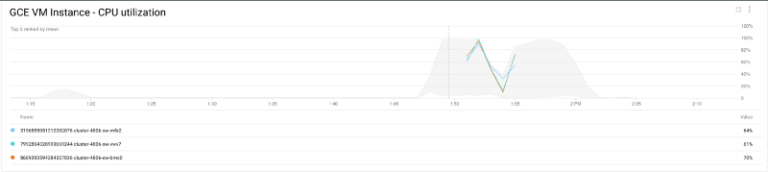
The instances CPU is getting busy and as Shamash is adding more nodes to the cluster, it becomes less busy and once the job is finished and the cpu utilization going down, Shamash is removing unnecessary nodes from the cluster.
Based on our experience with building Shamash, we have discovered once again the ease with which one can build relatively complex systems based on Google App Engine, Task Queues, Cloud Pub/Sub and Cloud Dataproc.
Shamash is open-source and we invite everyone to take part in improving it by submitting issues and pull requests at https://github.com/doitintl/shamash
Want more stories? Check my posts, follow me on twitter