Monitoring Short-Lived Kubernetes Jobs at Scale
 How we solved metric loss, cardinality explosion, and broken dashboards for ephemeral workloads using vmagent streaming aggregation
Introduction
You start using Kubernetes, deploy a few applications here and there. Start exposing metrics, you use Prometheus and the sun is shining. All is good.
You have a few jobs that you need to run. Same Prometheus package, expose metrics. Suddenly you hear your alert buzzing. Prometheus is OOM. You check your dashboards and indeed there are plenty of new time series, all unique by job_id. You double check dashboards and they seem to be incorrect for short-lived jobs.
This is a story that everybody runs into sooner or later.
In this article we will share how we found a way to approach it.
Background
Short-lived jobs are widely used in Kubernetes:
- Batch workloads
- CronJobs
- Event-driven pipelines
- Cost-optimized compute
They are efficient and scalable, but they create challenges for monitoring systems designed around long-lived services.
There are two classes of monitoring systems: pull-based and push-based. With push-based systems you send data whenever you want. Pull-based systems scrape targets at a set time interval.
Prometheus (and others) are pull-based by default. It keeps an inventory of targets, scrapes metrics at interval T in Prometheus format from a specified endpoint, and stores them in a local database.
For short-lived jobs this falls short on interval: if a job dies between T1 and T2, its metrics will not be scraped. Another common problem is cardinality. Every job will have either a pod_name or some other unique identifier, making each time series unique in the eyes of Prometheus.
We have many of these jobs and they are mission critical. Losing any metrics is not acceptable because we may calculate SLOs incorrectly, have false negative alerts, and miss important data for decisions. On top of that, the cardinality of pod names for these jobs is significant. Prometheus became a memory hog in our cluster, and any queries using these metrics ran slow and consumed a lot of resources.
Problem statement
- Collect all metrics from short-lived jobs
- Ensure correctness of metrics
- Keep cost and performance reasonable
- Support both dashboarding and alerting on top of it
- Make it engineer friendly (shared package, easy to reuse)
We would start from the "must" items and then work on UX. That means collecting and correctness first, then cost, performance, and shared packages.
Starting point
Crude approach:
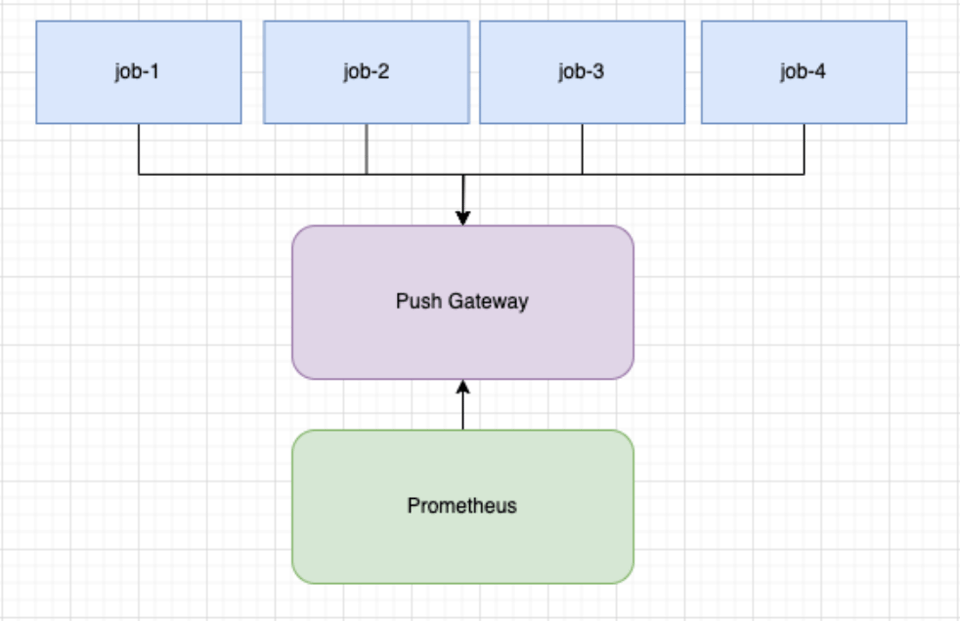
- Use Prometheus Pushgateway
- Register metrics with the default registry
- Push metrics on job completion
pusher := metric.NewPusher("reports", cfg.PromPushGatewayAddr)defer func() { if err := pusher.PushMetrics(); err != nil { logger.Errorf("could not push metrics: %s", err) }}()As a small improvement we can add a periodic pusher. This is a goroutine that periodically pushes metrics into the push gateway.
pusher := metric.NewPusher(jobName, cfg.PromPushGatewayAddr)pusher.PushPeriodicMetrics(logger.With(), 30*time.Second)defer func() { if err := pusher.PushMetrics(); err != nil { logger.Errorf("could not push metrics: %s", err) }}()This approach was better than nothing, but we saw problems with correctness. On every push there would be metric collisions across all jobs. This caused them to overwrite the final value in Prometheus, making counters go up and down (a correctness issue).
We decided to add pod_name to avoid such collisions and ensure correctness. POD_NAME would come from the Kubernetes Downward API.
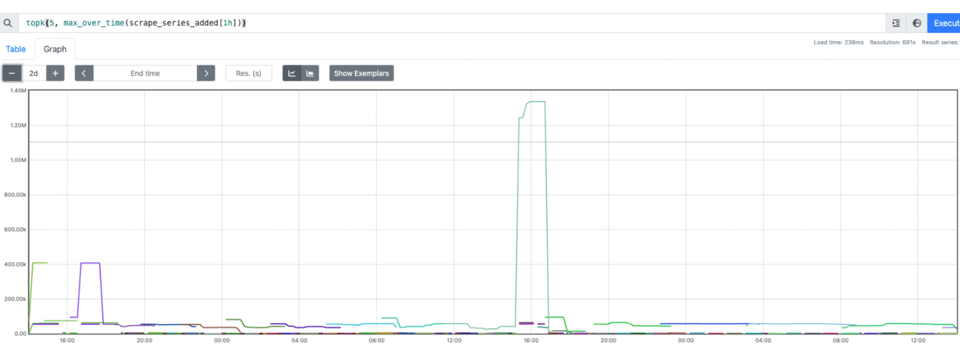
podName, exists := os.LookupEnv("POD_NAME")if !exists { podName = cfg.Conf.SvcID}pusher := metric.NewPusher(podName, cfg.PromPushGatewayAddr)After checking our data it did look correct. However, we could not build dashboards or alerts. To put it simply, increase was not working. For increase to work we need to calculate the delta between T1 and T2. Data would arrive only at T2, so if the metric was absent at the first scrape (first push does not happen) then there is no delta and no increase. We also noticed that Prometheus started to consume a lot of memory. Short-lived jobs are short-lived, and we have plenty of them, each with its own unique pod name, adding cardinality fast.
So we had correct data and a shared package that is easy to use. We still needed to cover building dashboards, alerts, improving performance, and reducing cost.
Improvement
We started with the obvious: use built-in recording rules in Prometheus. We added the following:
record: metric_name:aggrexp: sum(metric_name) without (job)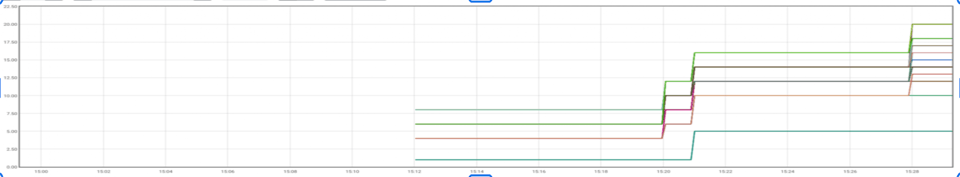
The problem with this approach was that we still did not have increase working. For frequently pushed metrics it was okay, but for short-lived jobs that were infrequent we would not have the important initial 0 value.
A bigger issue was that memory in Prometheus kept growing. On top of memory, we would recalculate and store this expression once every N interval, causing high CPU usage as well.
Final refinement
What we wanted was the following: before Prometheus stores anything, do the aggregation first and only then store the result. A bonus would be to have a 0 pushed before the actual value appears. Another bonus if we can have other aggregation rules, with minimal changes to dashboards, alerts, and easy for engineering teams to adopt. Something like this, but speaking Prometheus:
SELECT *, SUM(value)FROM METRICSWHERE METRIC_NAME LIKE 'COUNT'GROUP BY * WITHOUT JOB;Enter vmagent streaming aggregation. vmagenthttps://docs.victoriametrics.com/victoriametrics/vmagent/ is a lightweight, high-performance metrics collection agent designed by VictoriaMetrics to scrape, process, and ingest data from various sources into monitoring systems. It does exactly that: acts as a push gateway and pushes aggregated metrics into Prometheus.
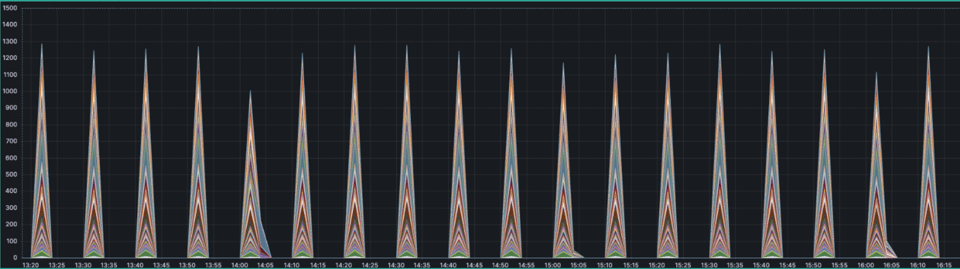
Example rule for count metrics that we push:
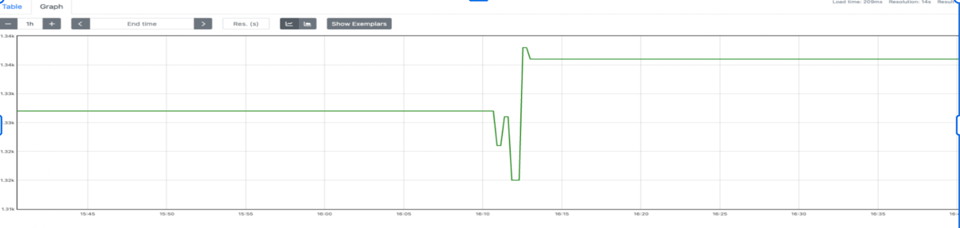
- match: '{__name__=~".+_count"}' interval: 2m outputs: ["total"] without: ["pod_name"] staleness_interval: 15m keep_metric_names: true flush_on_shutdown: trueAnd our graphs started to look just as we expected.
Final solution
+-----------------------------+| K8s Jobs || (shared metrics package) |+-------------+---------------+ | | push metrics v+-----------------------------+| Push Endpoint || (e.g. Pushgateway) |+-------------+---------------+ | | metrics flow v+-----------------------------+| vmagent || (streaming aggregation) || - reduce cardinality || - aggregate counters |+-------------+---------------+ | | push v+-----------------------------+| Prometheus || (stores aggregated data) |+-----------------------------+To highlight the flow: we have a shared package that periodically pushes metrics into vmagent. It includes pod_name as a label. At the end of execution it does a final push.
Data arrives in vmagent, which holds aggregation state. It sums arriving counters by metric name. Once per interval it pushes the result to Prometheus.
Now we have satisfied all our requirements.
Problems
Pre-aggregating data means we lose raw data. If someone wants to fetch metrics for a specific pod, that is not possible.
vmagent stores state. If it resets, we start from 0. That is okay for dashboards and alerts, and you can do a regular sum() to cover gaps. However, during vmagent unavailability we will lose data.
On top of that, we are running an additional component that we need to configure and manage.
Monitoring short-lived workloads at scale takes more than default tooling. It takes deliberate architecture choices. If your team is working through similar Kubernetes observability challenges, our engineers can help you design and implement solutions that fit your stack. Learn more at https://www.doit.com/solutions/forward-deployed-engineering.