Introduction
Cloud monitoring is essential for maintaining and optimizing AWS infrastructure, with Amazon CloudWatch being a primary tool for tracking metrics, logs, and alarms. However, as your AWS usage scales, so do your CloudWatch costs — and sometimes, those costs can be difficult to trace.
A common challenge AWS users face is pinpointing the exact cost drivers for CloudWatch in the Cost & Usage Report (CUR). While the report provides a high-level breakdown, it lacks the detailed attribution needed to identify specific sources of high costs.
This article presents a real-world example of diagnosing unexpected CloudWatch costs using DoiT Cloud Intelligence. After identifying high-cost operations, we will demonstrate how to leverage CloudTrail data events and Amazon Athena to uncover the origins of these charges and gain actionable insights. By the end, you’ll have a clear strategy for understanding and managing hidden CloudWatch costs.
Problem Statement
Amazon CloudWatch is an essential monitoring tool for AWS environments, offering detailed insights into metrics and logs. However, its cost structure can sometimes feel opaque, making it challenging to identify the source of unexpected billing spikes.
While the Cost & Usage Report (CUR) provides a granular breakdown of AWS costs, it falls short when it comes to resource-level visibility for specific charges. A notable example is GetMetricData, an API operation used to retrieve CloudWatch metric data. Despite its significant impact on costs, CUR does not provide sufficient detail to determine which services, applications, or users are responsible for these charges.
This lack of transparency makes it challenging for AWS users to optimize costs, prevent budget overruns, and make informed decisions about their monitoring configurations.
Identifying High Costs in CloudWatch
To illustrate this challenge, we used DoiT Cloud Analytics reports, which help visualize and interpret cloud cost data. The cost data can be represented in various diagrams, filtered and grouped for better insights.
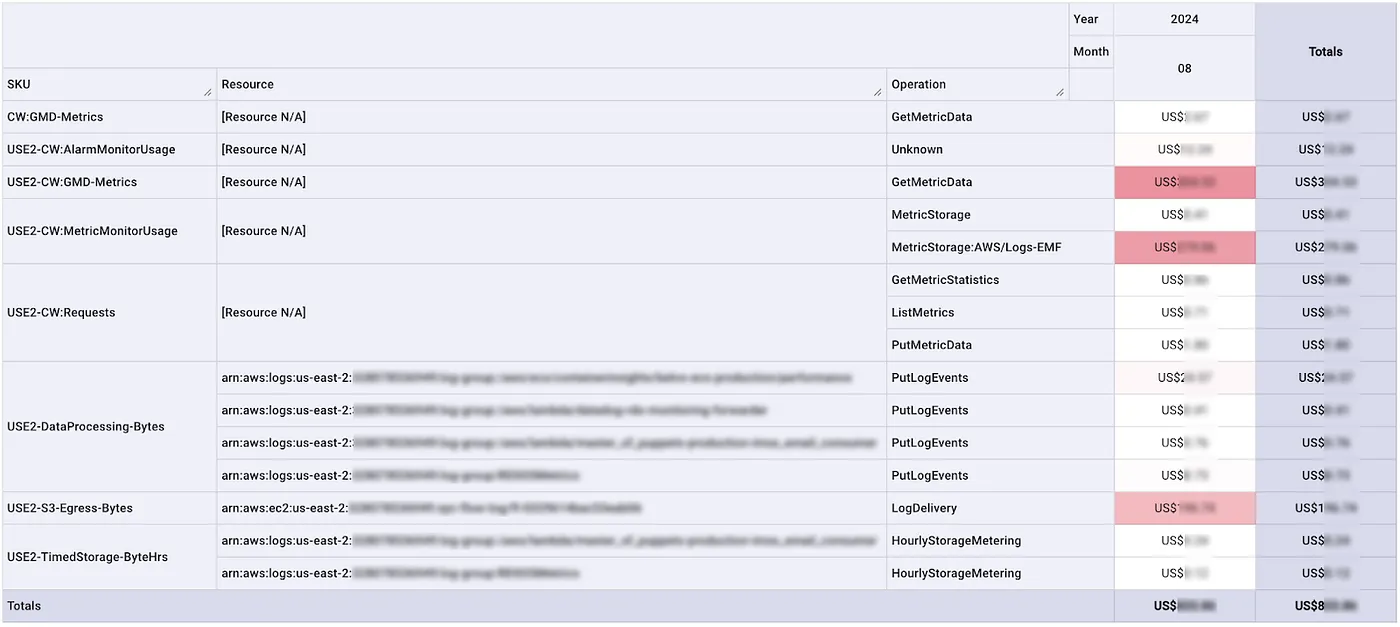
For instance, the following analysis provides a detailed cost breakdown of CloudWatch usage over 28 days, highlighting the consistently high costs associated with GMD-Metrics (GetMetricData) operations.
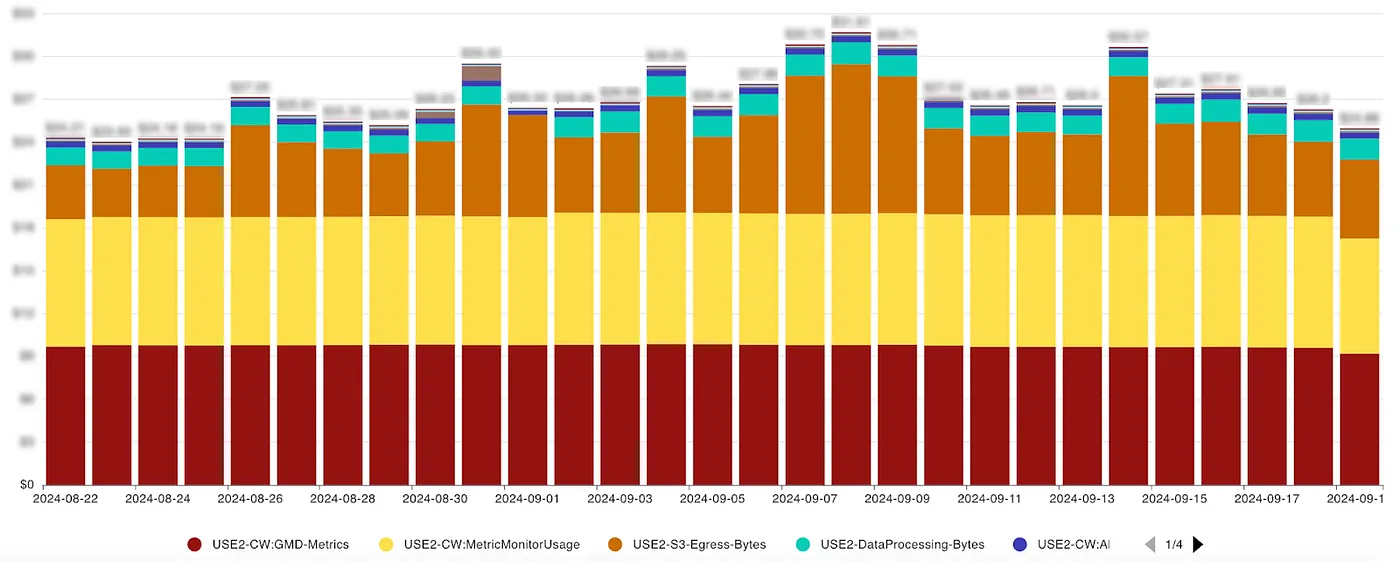
The cost table below further categorizes CloudWatch expenses by SKU (Stock Keeping Unit), operation type, and resource information. Notably:
- GMD-Metrics (
GetMetricData) is a top cost driver. - Resource information is missing, making it difficult to determine the source of these requests.
- MetricMonitorUsage also contributes to costs, but to a lesser extent.
Since GetMetricData is driving significant and unexplained costs, we need a more detailed investigation using CloudTrail data events and Amazon Athena to trace its origin.
Enabling CloudTrail Data Events
AWS CloudTrail logs management events by default, such as IAM changes, security configurations, and resource provisioning. However, data events, which capture service-specific API calls like S3 object-level operations or Lambda executions, are not enabled by default.
Since we need to track CloudWatch Metrics events, we must explicitly enable CloudTrail data events. This can be configured in an existing trail or by creating a new one.
Setting Up CloudTrail
1. Choose a CloudTrail trail
- Modify an existing trail or create a new one.
- Define an S3 bucket for storing CloudTrail logs.
2. Configure Optional Features
- KMS Encryption (optional) for added security.
- Log validation & SNS notifications (optional, for integrity and alerts).
- CloudWatch Logs storage (not applicable here since we use Athena for analysis).
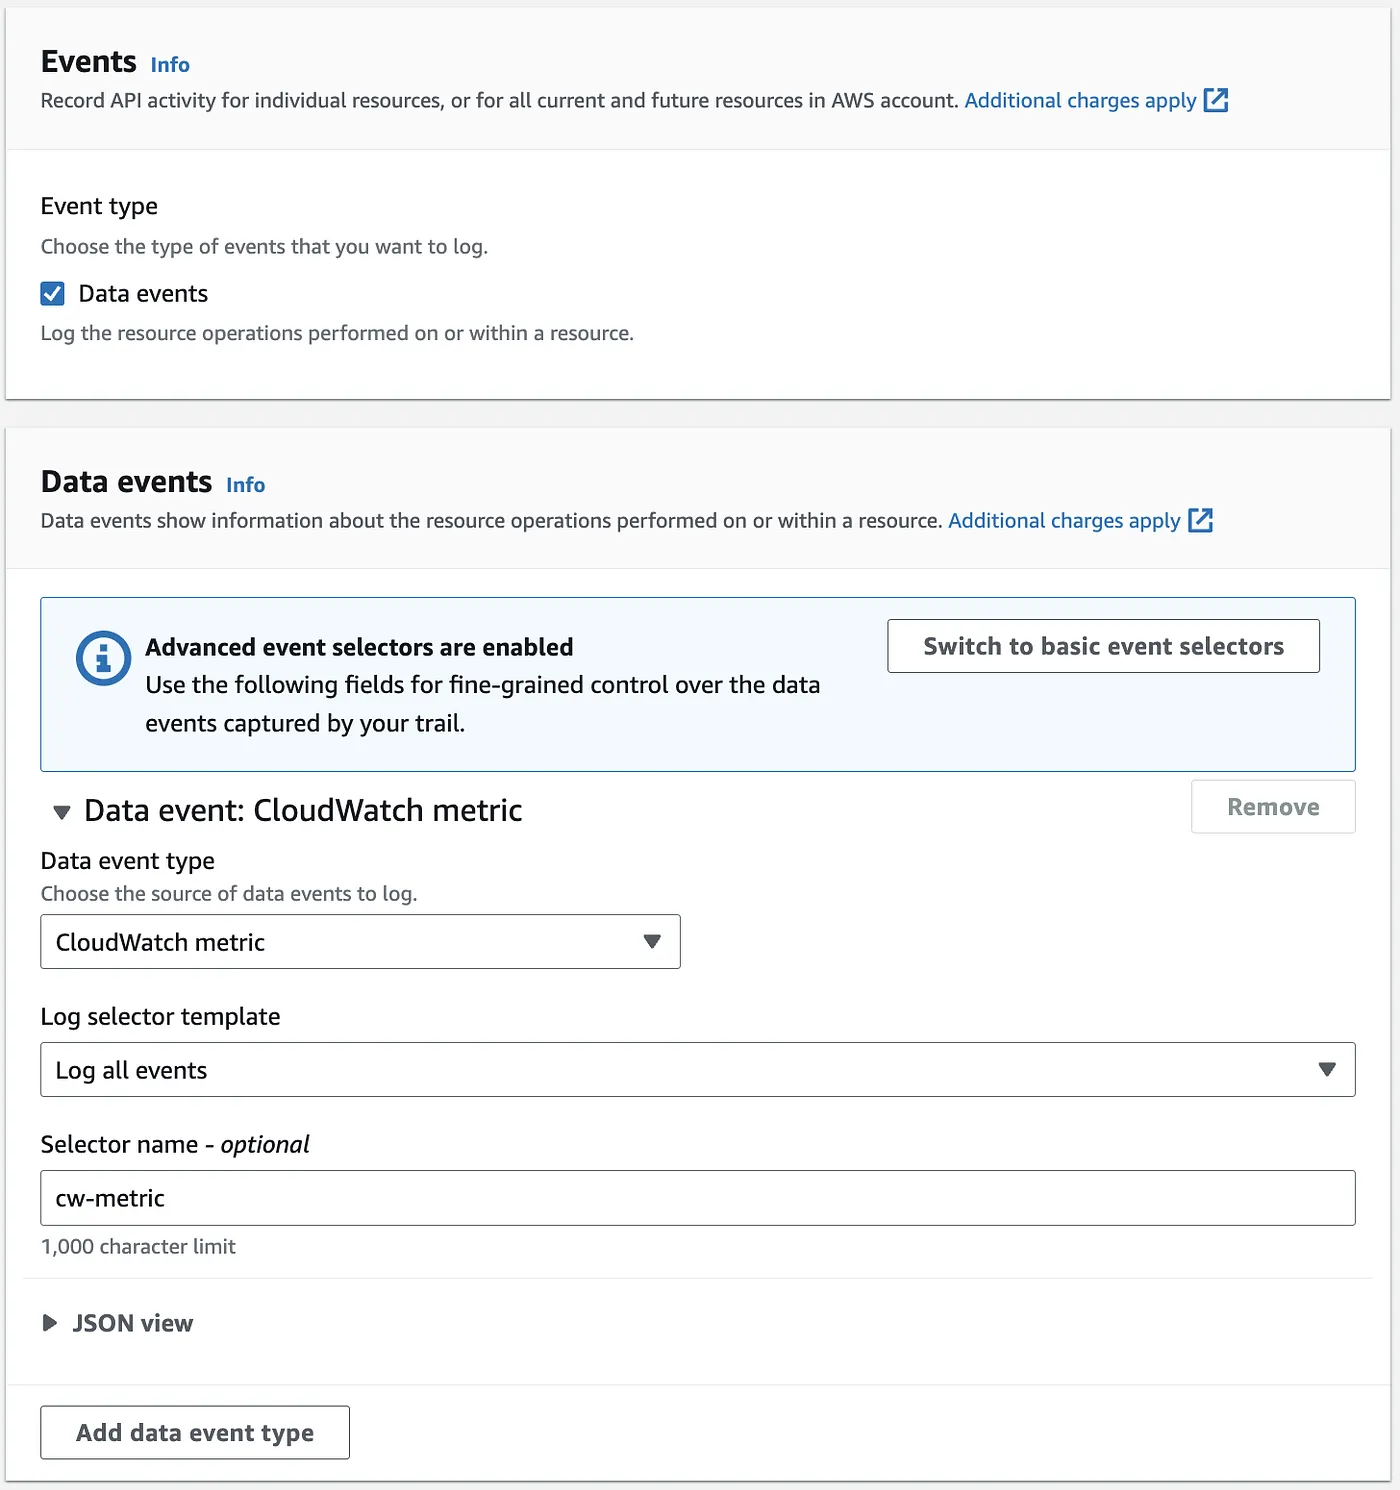
Defining the Data Event for CloudWatch Metrics
1. Select CloudWatch metric as the Data Event Type.
2. Specify Log Selector:
- All events (our choice for simplicity).
- Read-only events or Write-only events
- Use Custom selectors for more control.
Analyzing Log Data via Athena
Creating an Athena Table for CloudTrail Logs
With CloudTrail now logging CloudWatch GetMetricData requests to an S3 bucket, we can use Amazon Athena to analyze them.
To analyze CloudTrail logs using Amazon Athena, you must create a table referencing the log data stored in your S3 bucket:
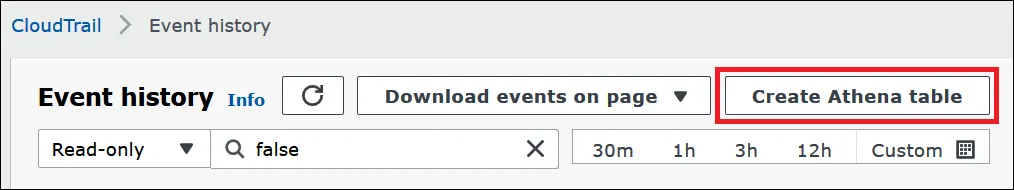
- Access the CloudTrail Console and navigate to Event history in the left-hand menu.
- Click on Create Athena table, and in the Storage location dropdown, select the S3 bucket where your CloudTrail logs are stored.
Querying GetMetricData Events
Now, we can query who or what is making GetMetricData requests in Amazon Athena. This SQL query is just an example using a small sample dataset. For a real dataset, a different query may yield more accurate results.
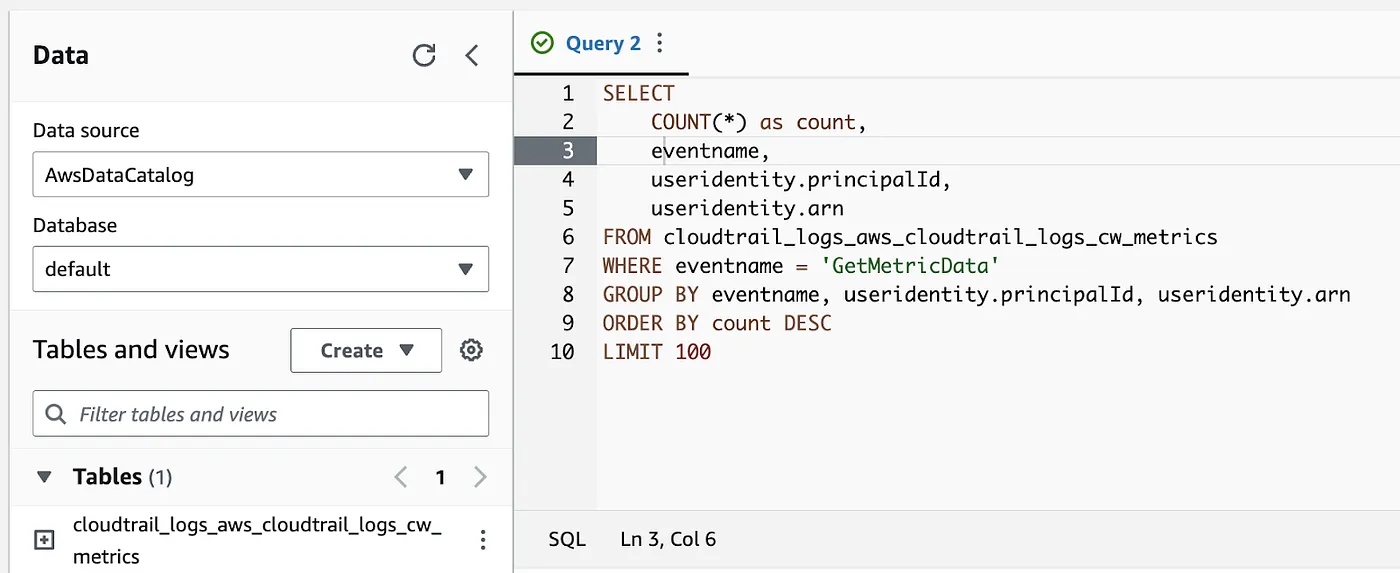
SELECT
    COUNT(*) as count,
    eventname,
    useridentity.principalId,
    useridentity.arn
FROM cloudtrail_logs_aws_cloudtrail_logs_cw_metrics
WHERE eventname = 'GetMetricData'
GROUP BY eventname, useridentity.principalId, useridentity.arn
ORDER BY count DESC
LIMIT 100;
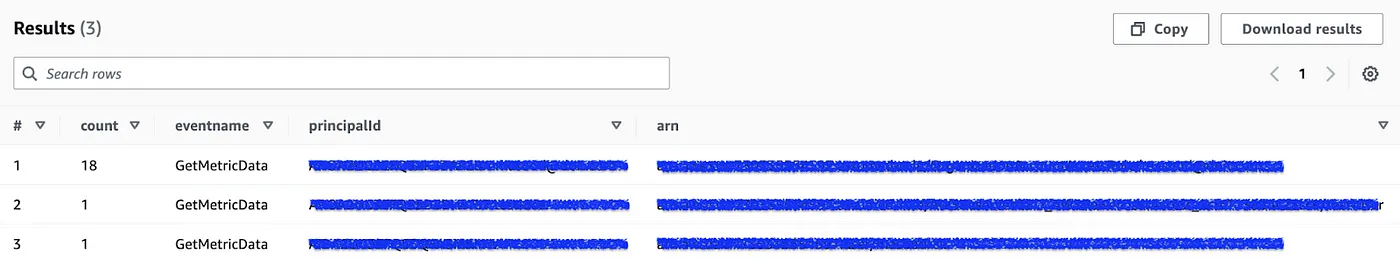
Interpreting the Results
The query results (example shown below) reveal the sources generating GetMetricData requests.
- The top row shows 18 requests, making it the primary cost driver.
- The
principalId andarn columns help identify whether the requests originate from a specific AWS service, IAM user/role, or application. - If excessive requests are unnecessary, consider reducing polling frequency, optimizing monitoring settings, or restricting access to lower costs.
Conclusion
Hidden CloudWatch costs, particularly those driven by GetMetricData, can be challenging to track using AWS's Cost & Usage Report (CUR). By using CloudTrail data events and Amazon Athena, we gained detailed insights into the exact sources responsible for these requests.
To avoid future unexpected high costs, consider:
- Optimizing metric queries to reduce frequency.
- Restricting IAM permissions for
GetMetricData. - Using AWS Cost Explorer or DoiT Cloud Intelligence for real-time cost monitoring.
With these strategies, you can gain full visibility into CloudWatch costs, ensuring efficient monitoring without unnecessary expenses. If you’ve encountered similar challenges, try this approach and share your findings!