
Skyrocketing demand for your software solutions is supposed to be exciting, right? In most cases this is a reason to celebrate yet there is a common oversight in public cloud hosting that can cripple your company, or even result in an outage — limits and quotas.
Don’t get caught off guard when it matters most
At DoiT International, we serve thousands of organizations worldwide as their trusted cloud partner and finops software solution provider. With tens of thousands of customer requests handled each month by our cloud architects, a common oversight we witness is failure to anticipate reaching quota limits. This often results in frantic requests for assistance to speed up the cloud vendor’s fulfillment of quota increase requests.
Quota increase support requests received from our customers
Our decade-long passion is to innovate and deliver on the true promises of the cloud: simplicity, elasticity, and efficiency. To assist our customers with this recurring issue, we added quota monitoring and alerting capabilities into our own multi-cloud software platform, the DoiT Console.
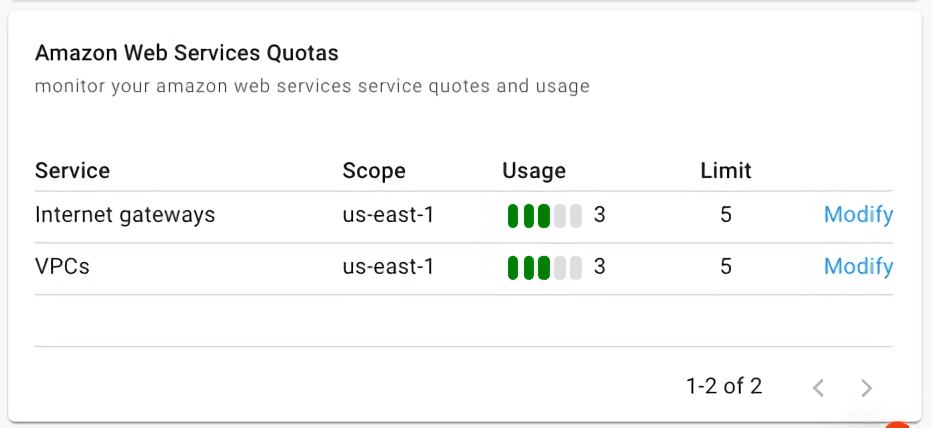
Example: DoiT Console Quota Monitoring Functionality For AWS Customers
Unfortunately, not everyone using public cloud hosting is a DoiT customer (yet), and thankfully the team at Google also recognized this issue and open-sourced a project called “Quota Monitoring Solution (QMS)”.
Google Open-source Quota Monitoring Solution
While the Github repository for this solution includes step-by-step instructions, this article attempts to simplify the steps to get you up and running quickly. For more detailed explanations of each step feel free to read the documentation in the repository.
Within less than twenty minutes using gcloud and terraform commands in a terminal, you can have a dashboard like below, and customize alerting thereafter to suit your organization’s needs.
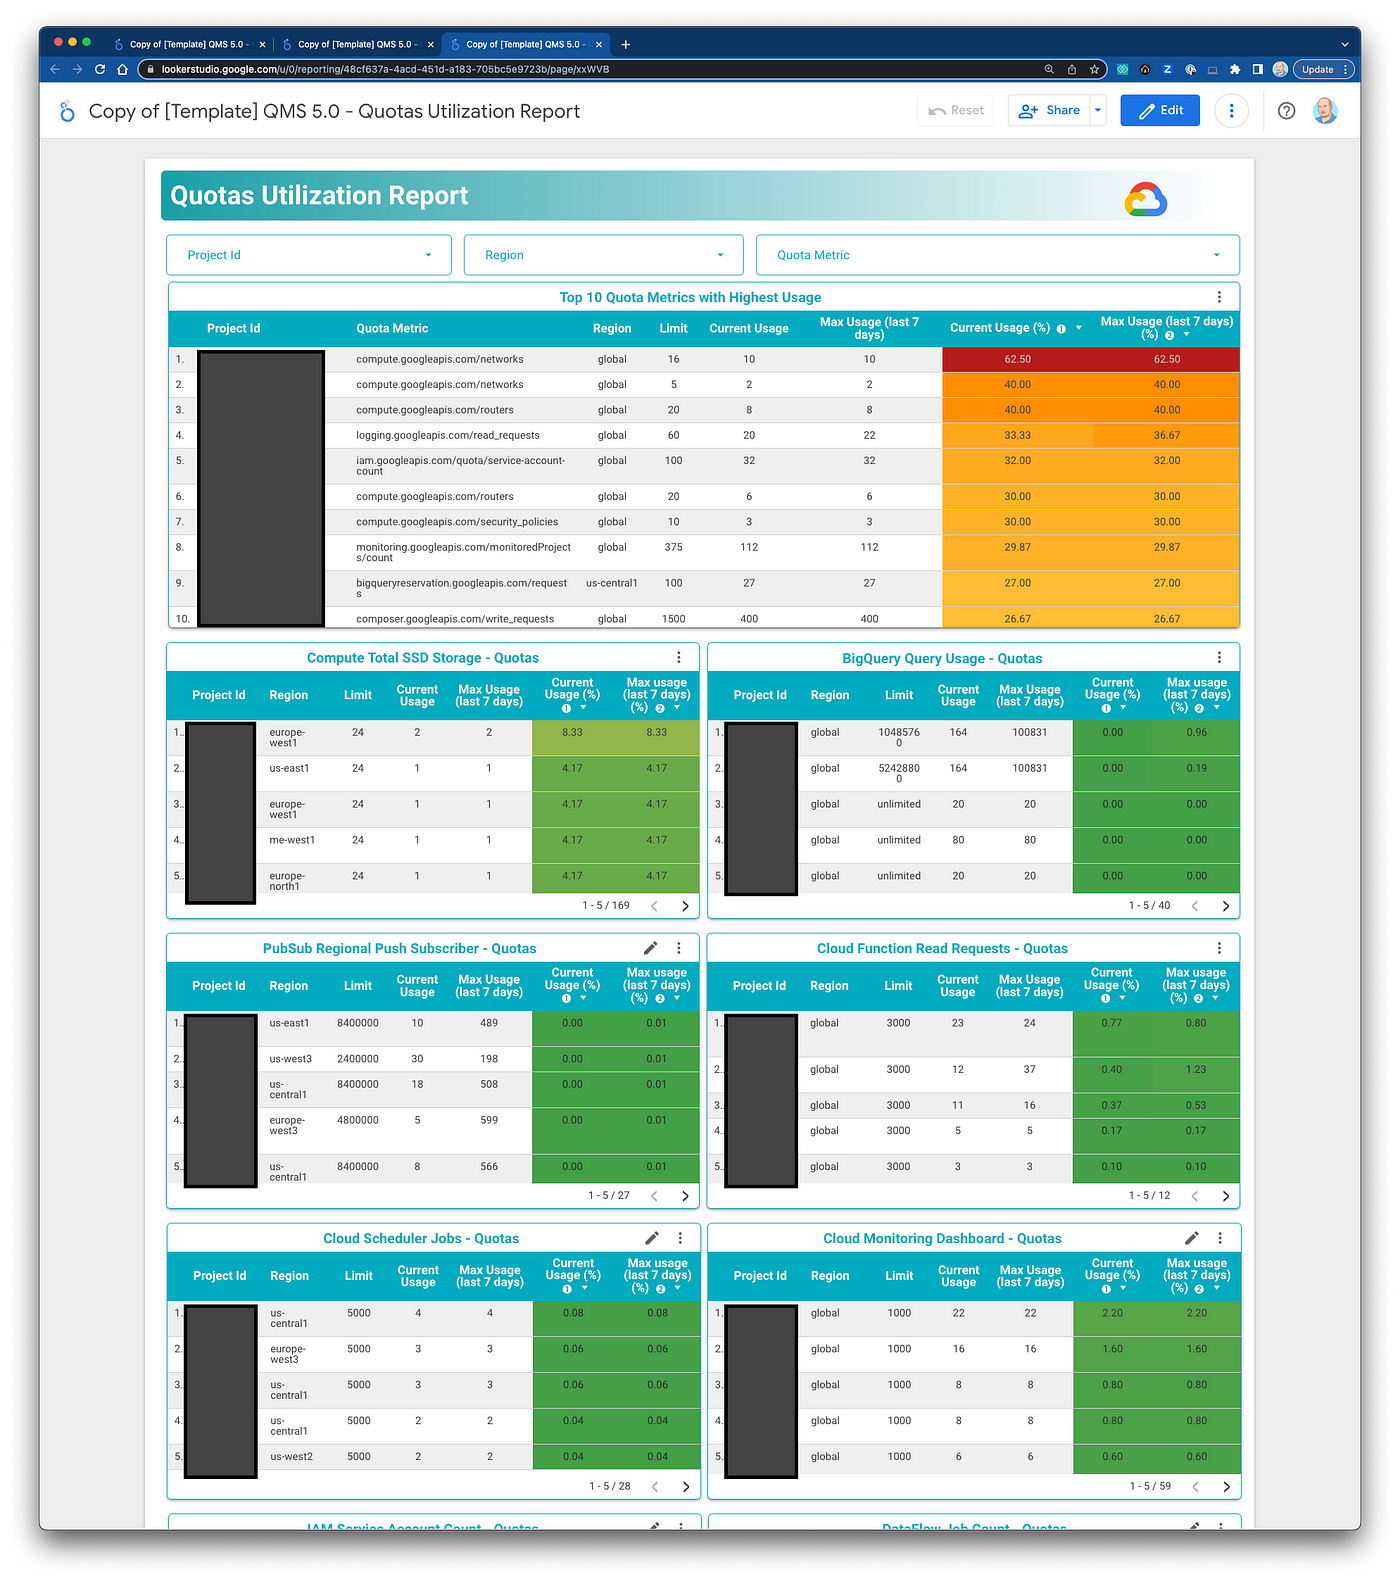
Looker Studio dashboard displaying your quota usage at org, folder, region, or project level
Features
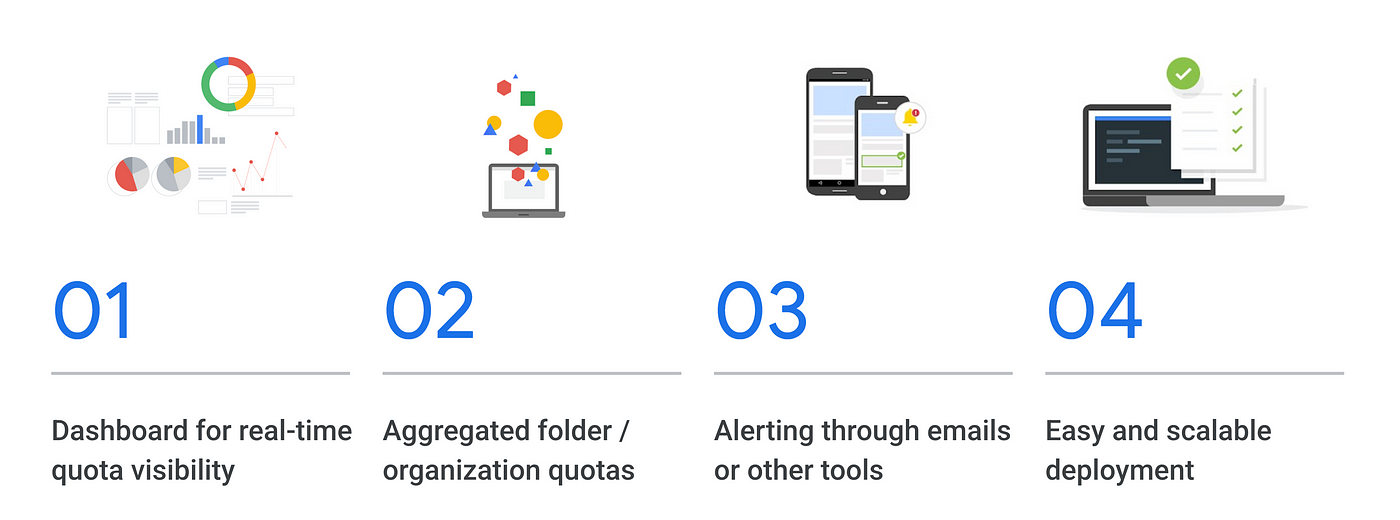
Source: Google
Architecture
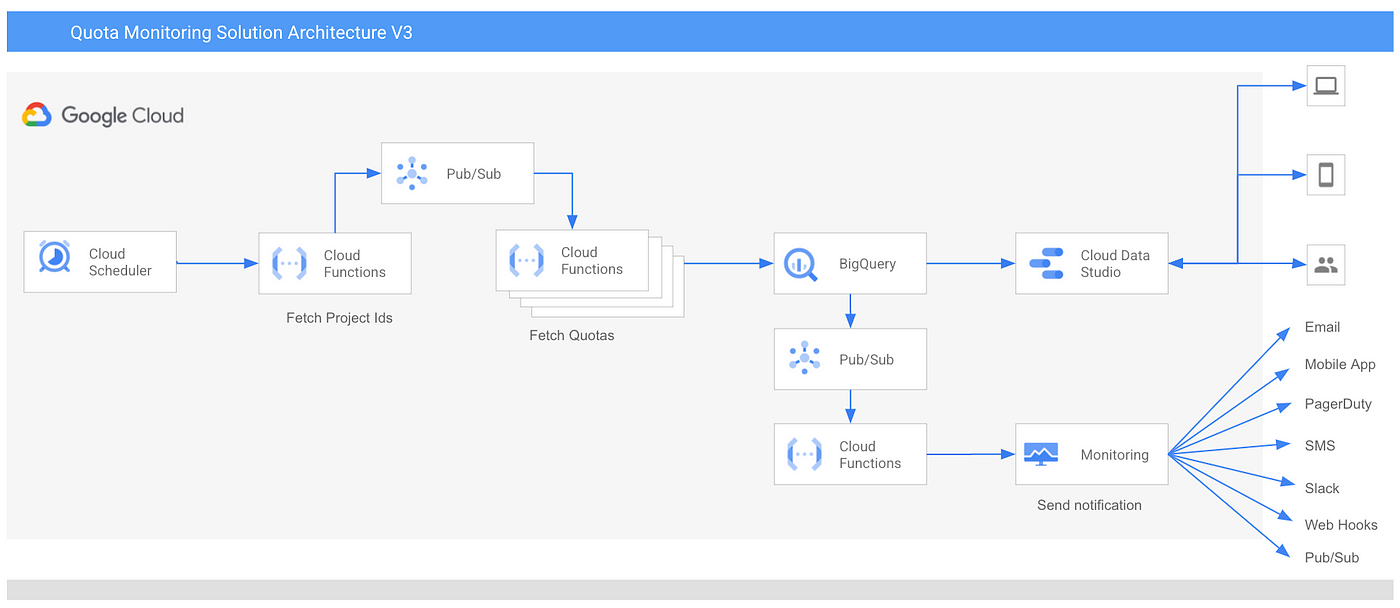
Source: Google
This article will walk you through the following:
-
- Setup and configure your QMS environment
- Install QMS using Terraform
- Setup your Looker Studio dashboard
So let’s get started!
Prerequisites
Ability to run gcloud commands in terminal or cloud shell
Although you could set up the service manually in the Cloud Console, it was designed to be installed and configured using a terminal and shell commands. You can either use your preferred terminal client, or simply use the built-in Cloud Shell in the GCP Console.
Ability to run Terraform
You will need to install the Terraform command line tool on your machine or in Cloud Shell. Configuration of the cloud infrastructure and serverless functions are automated using infrastructure as code (IaC).
Ability to assign IAM role permissions
In order to continue, you will need several IAM roles to create a monitoring project, service account, and assign roles to the service account. It’s recommended that you or someone on your team with the Organization Administrator role ensure you have these roles below:
- Project Creator
- Service Account Creator
[Organization | Folder | Project] IAM Admin
Service Account Token Creator
1. Setup and configure your QMS environment
To simplify the setup and configuration, I prepared a script that completes the following for you:
- Create monitoring project, service account, and service account IAM
Target (org or folder) IAM
Terraform config and instructions
Run the command below in your terminal or cloud shell to initiate setup.
Tips
Simply hit RETURN to accept the [defaults]: in prompts
Have your billing ID (xxxxxx-xxxxxx-xxxxxx) ready to copy/paste
bash <(curl -L https://bit.ly/gcp-qms-setup)
You can view source code here: https://bit.ly/gcp-qms-setup
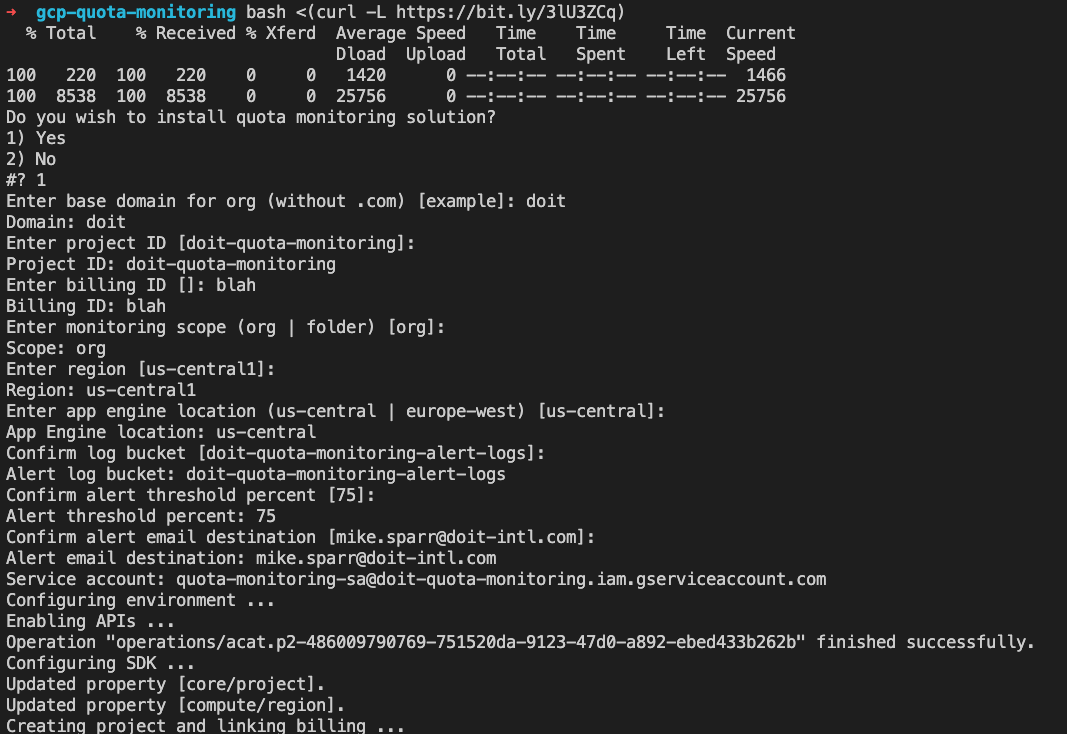
Example of terminal prompts when running install script above
2. Install QMS using Terraform
When the script completes initial setup, it will prompt you to authenticate and run terraform yourself, allowing you to inspect the plan before applying (and retrying if any errors).
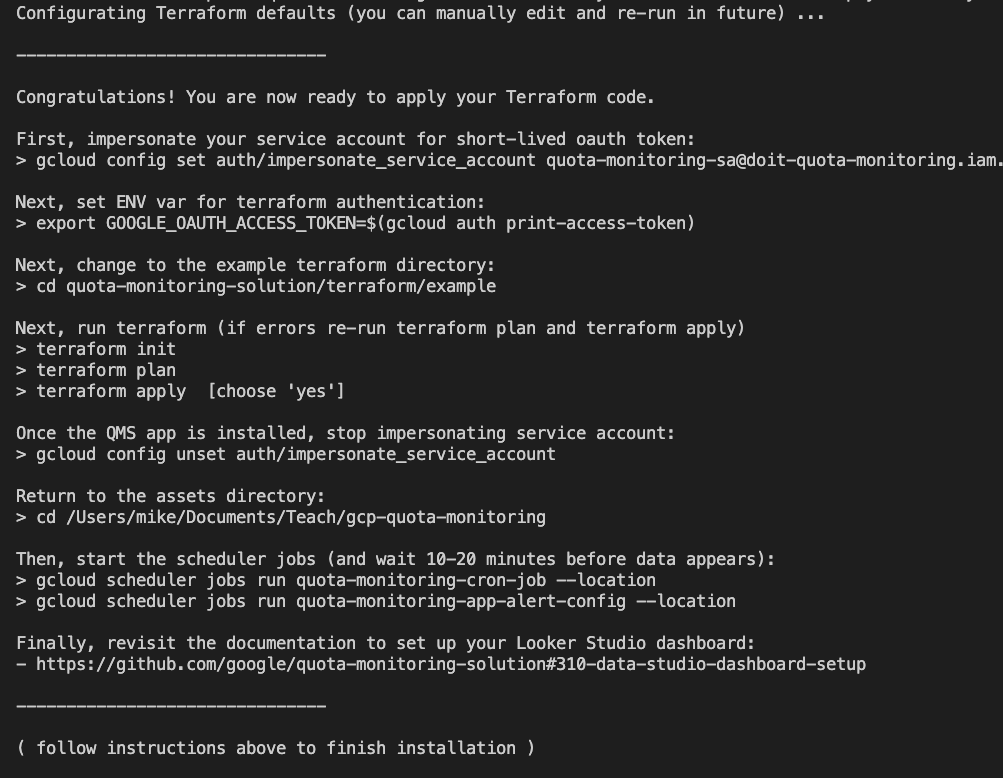
Example of terminal prompt after setup script, providing final commands to run terraform
Install commands (replace <your-…> with correct values)
PROJECT_ID=<your-project-id>
SA_EMAIL=<your-sa-email-address>
REGION=<your-region>

# configure gcloud sdk
gcloud config set core/project $PROJECT_ID

# set up short-lived oauth token
gcloud config set auth/impersonate_service_account $SA_EMAIL
export GOOGLE_OAUTH_ACCESS_TOKEN=$(gcloud auth print-access-token)

# run terraform (re-run `terraform plan` and `terraform apply` if errors)
cd quota-monitoring-solution/terraform/example
terraform init
terraform plan
terraform apply

# unset service account impersonation
gcloud config unset auth/impersonate_service_account

# return to project directory
cd ../../../

# start cloud scheduler jobs to begin monitoring quotas
gcloud scheduler jobs run quota-monitoring-cron-job --location $REGION
gcloud scheduler jobs run quota-monitoring-app-alert-config --location $REGION
3. Set up your Looker Studio dashboard
After you ran the setup and installed the app via terraform, you will set up your dashboard by following the steps below (order is important I discovered)
Open the Looker Studio template
Click the “…” (3 dots) menu near top right and “Make a copy”
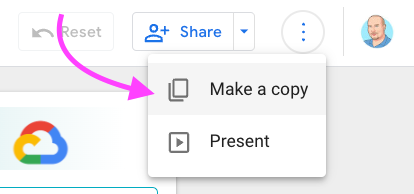
When prompted for datasource, continue with the default selection
You should now see a copy of the Looker Studio dashboard template in another browser tab. What you will need to do next is connect it to your dataset that was created earlier, in your project.
Connecting to your dataset
I found this to be temperamental and order matters, but if at first you don’t succeed, try try again.
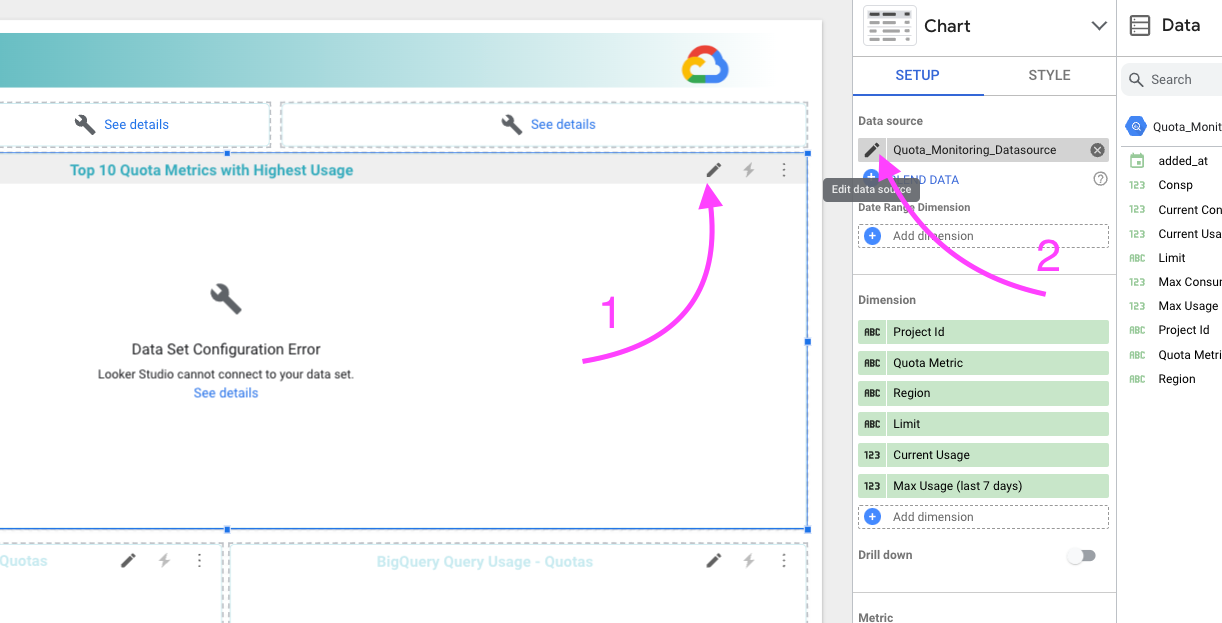
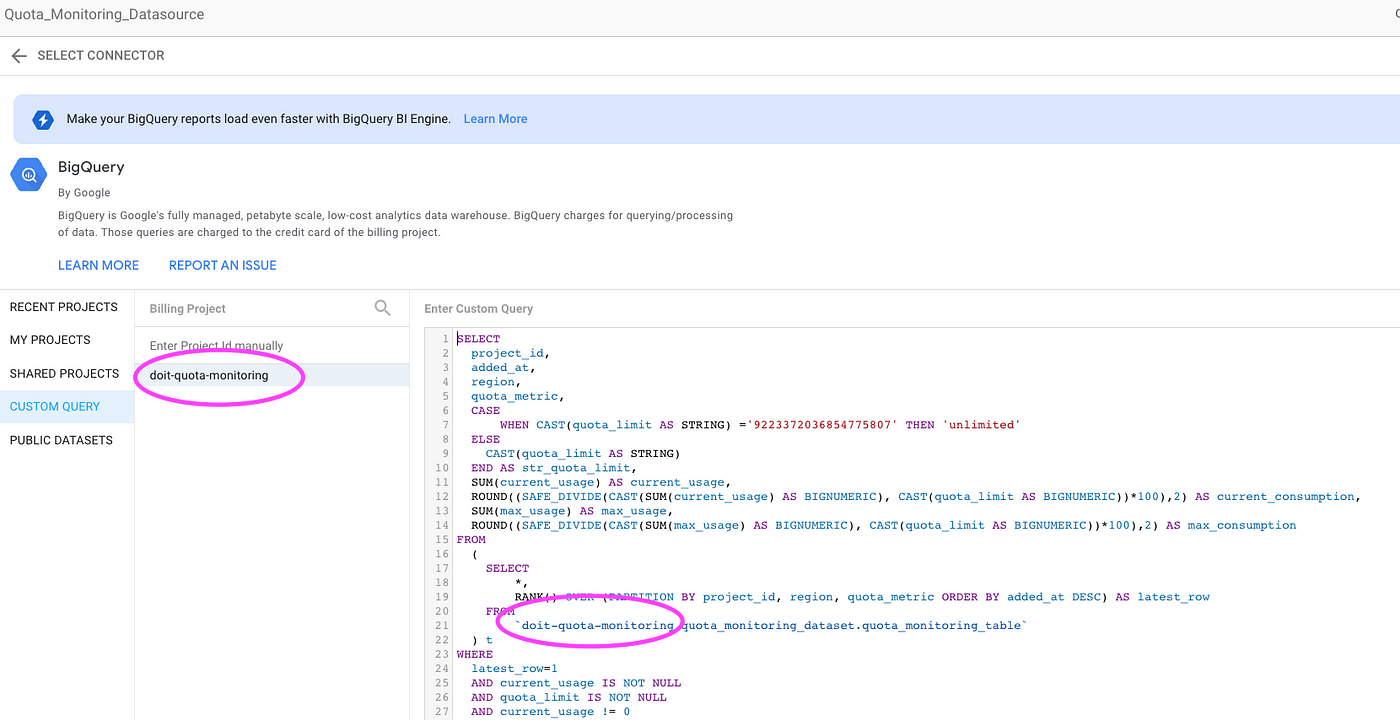
A panel will appear at the bottom with an SQL query, and you will need to edit it and replace your [project ID].[dataset].[table].
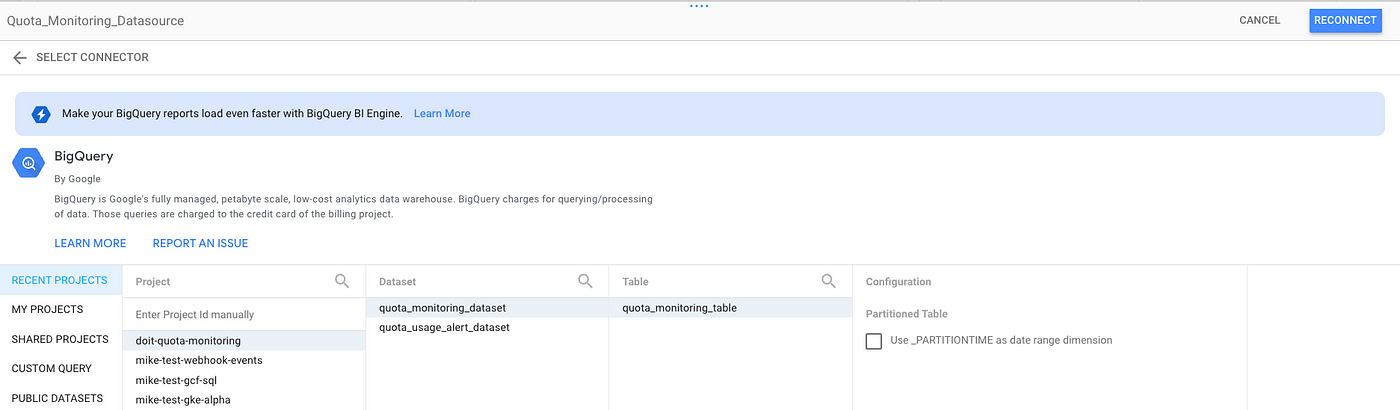
On the left it lists projects and yours may not appear. Try searching for it, and if that doesn’t auto-populate with your project, click the “Recent Projects” tab and select your project -> dataset -> table.
Return to the test query tab, and make sure your project ID is still in the query (and not return to the template default).
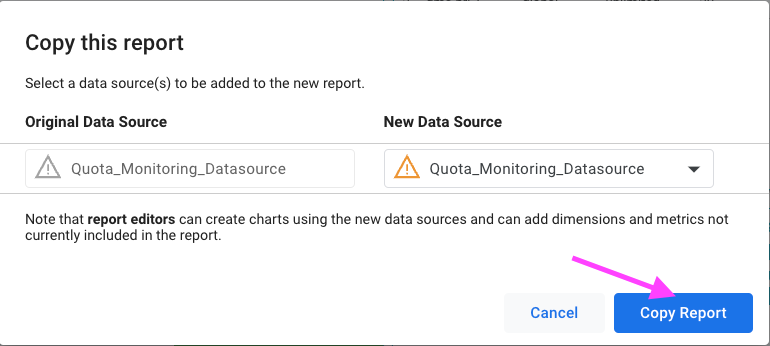
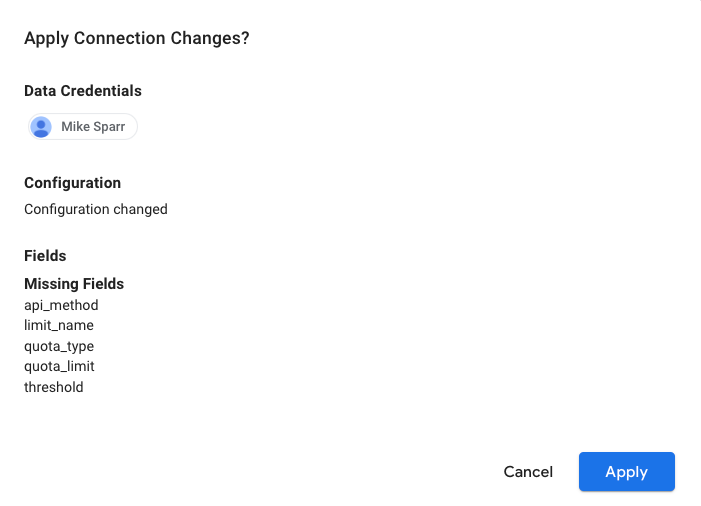
Click on “Reconnect” button to the top-right of that panel. When prompted, confirm changing data source and hit “Apply”
Congratulations!
You should see the data populate in the dashboard. If not, retry steps above as it can be “finicky” and a couple retries usually solves.
Simply click on “Done” to close the panel, and optionally “View” to view your dashboard.
Configuring monitoring / alerts
Google’s docs describe optional additional customization and configuration you can do for alerting.
Now you can stay informed and catch potential quota issues before they risk outages.