
Combine the power of Grafana and DoiT Cloud Analytics for superior cloud cost analytics and monitoring
DoiT Cloud Analytics is a modern cost management platform for digital-native companies, providing instant visibility into your cloud costs. Grafana is an open-source platform for beautiful analytics and monitoring. Wouldn't it be nice to combine the power of both? We thought it would!
DoiT's Cloud Analytics platform allows you to build advanced cloud expenditure reports and share them with your team. You can group resources and their associated costs with custom attributions, detect and analyze trends, forecast your cloud costs and manage your budgets without having to spend agonizing hours manually scanning cloud bills. Likewise, for visualizing time-series data, Grafana is the way to go: For monitoring, alerting, or analysis. Grafana supports many popular time-series data sources such as Prometheus, InfluxDB, Graphite, Elasticsearch and many others.
The applications are nearly endless — dashboards analyzing logs, campaign metrics, traffic analysis and, alongside these, you can accurately monitor your Amazon Web Services or Google Cloud expenses by passing Cloud Analytics Data to Grafana.
So, how do you make this work? Our platform exposes a RESTful API, making it easy to fetch any report you have built with DoiT Cloud Analytics. You can learn about these Report APIs and how to use them at DoiT Developer Portal.
Natively, Grafana cannot fetch data from REST APIs, but luckily there is an Infinity plugin that does exactly that - integrating Grafana with JSON, CSV, XML, GraphQL and HTML endpoints.
Step 1
Install the Infinity plugin from grafana.com, using grafana-cli or directly from GitHub. Use the plugin web page to get started.
Step 2
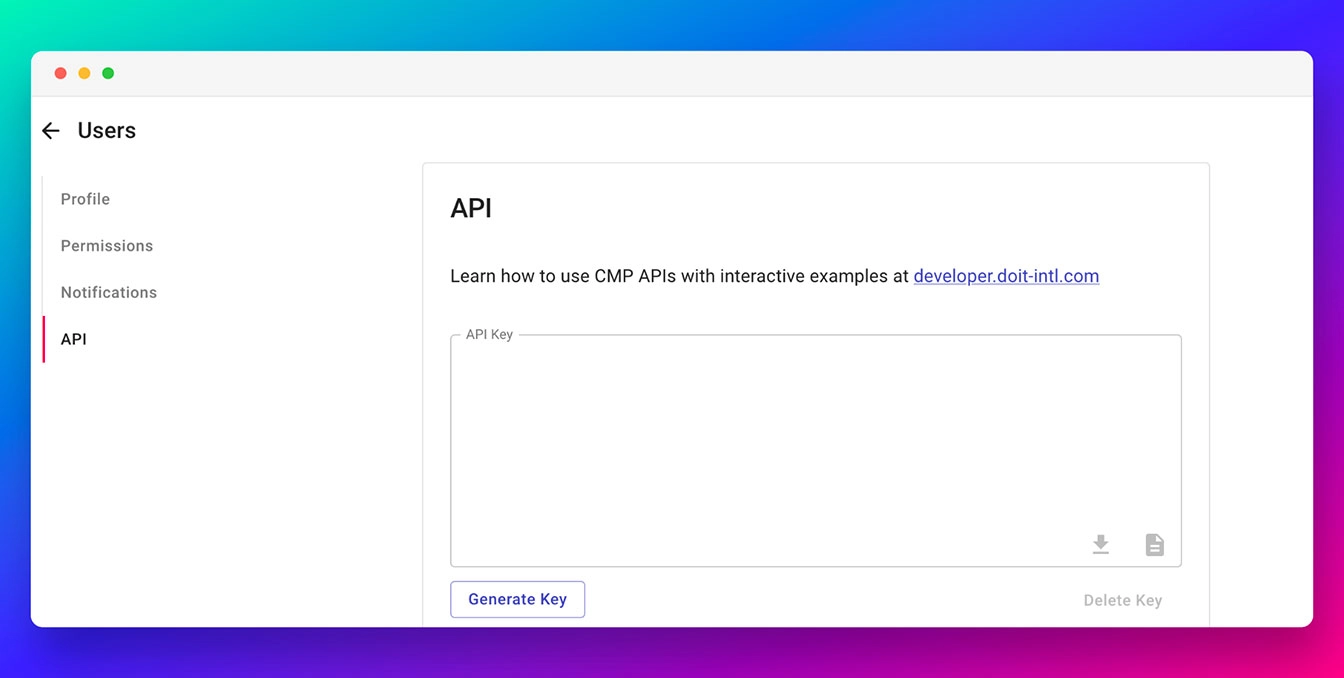
To use the Reports API, you’ll need an API key. You can generate your Cloud Analytics API key from your user profile using the instructions on DoiT Developer Portal.
Step 3
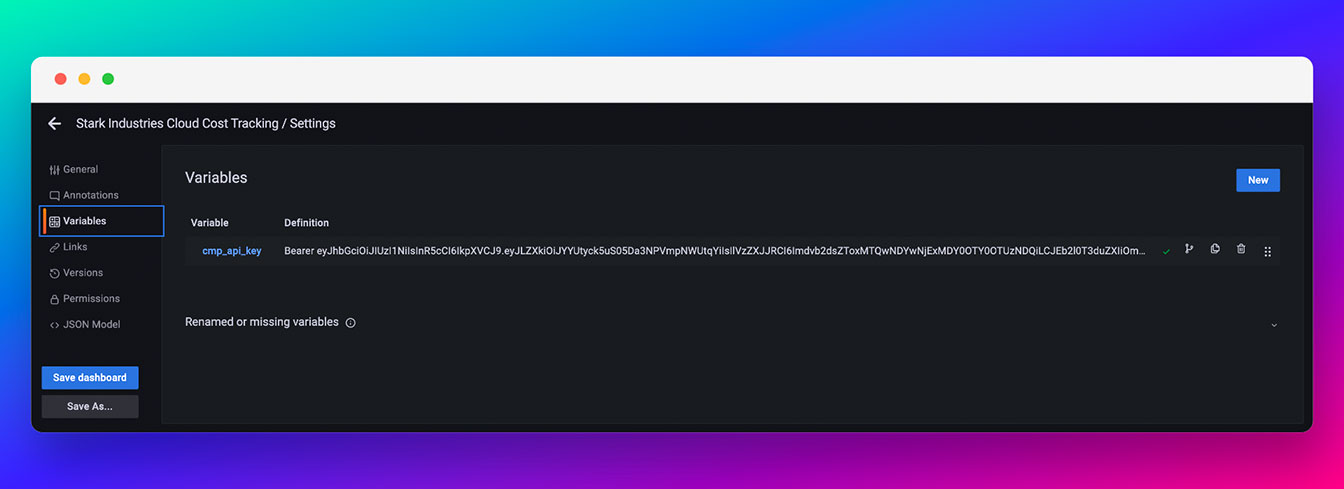
Set the API key in the designated Grafana dashboard by updating the cmp_api_key variable. Set the value of the variable to “Bearer “ (note the trailing space) followed by the API key itself.
Step 4
Add a new panel to your Grafana dashboard. Use “Infinity” as a data source. Configure the panel using the following settings:
Type should be set to “UQL”
Source should be “URL”
Format needs to be set to “Time Series”
URL has to be set to your Cloud Analytics Report URL. This is what you’d typically use with reports.get() API method of the Reports API (reference).
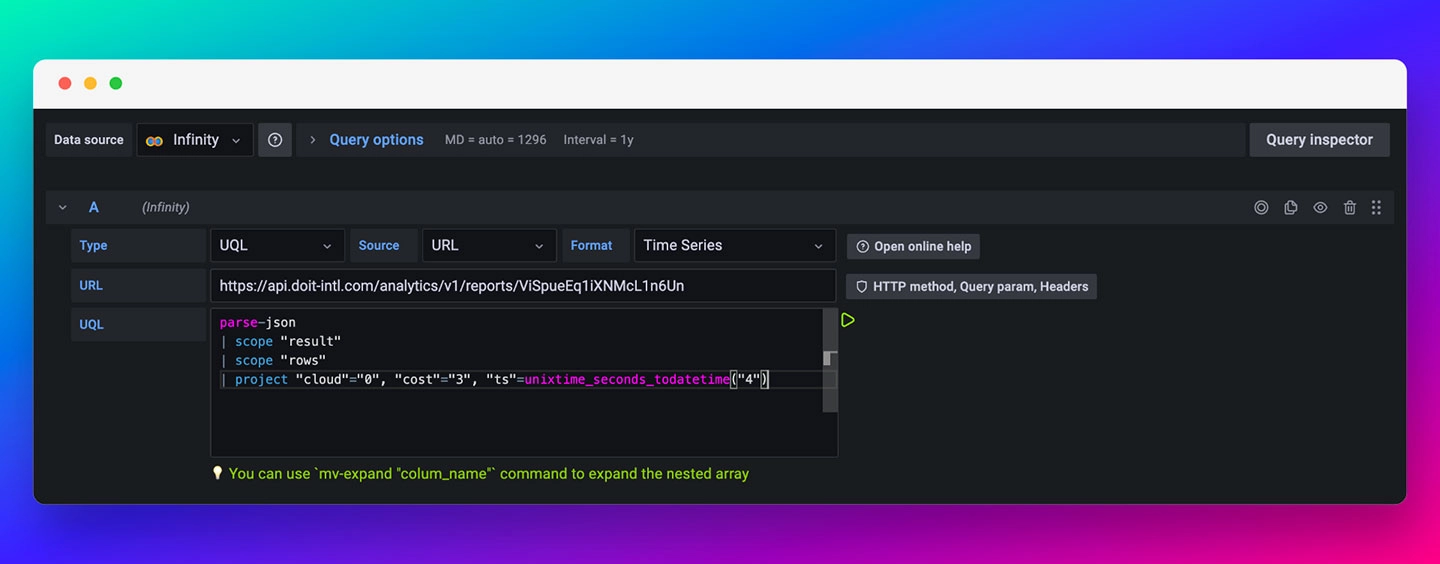
Now, the interesting part is the UQL query. This is where you convert the reports.get()response to the format Grafana can understand.
The UQL is an opinionated query language designed for in-memory operations. UQL query can be formed with a list of commands joined by | (pipe) each in a separate line. Most of the time, fields are referred to within double quotes, and string values are referred to with single quotes. More about UQL syntax can be found here.
The call to reports.get()in my example provides the following response.I remove parts of the response for brevity:
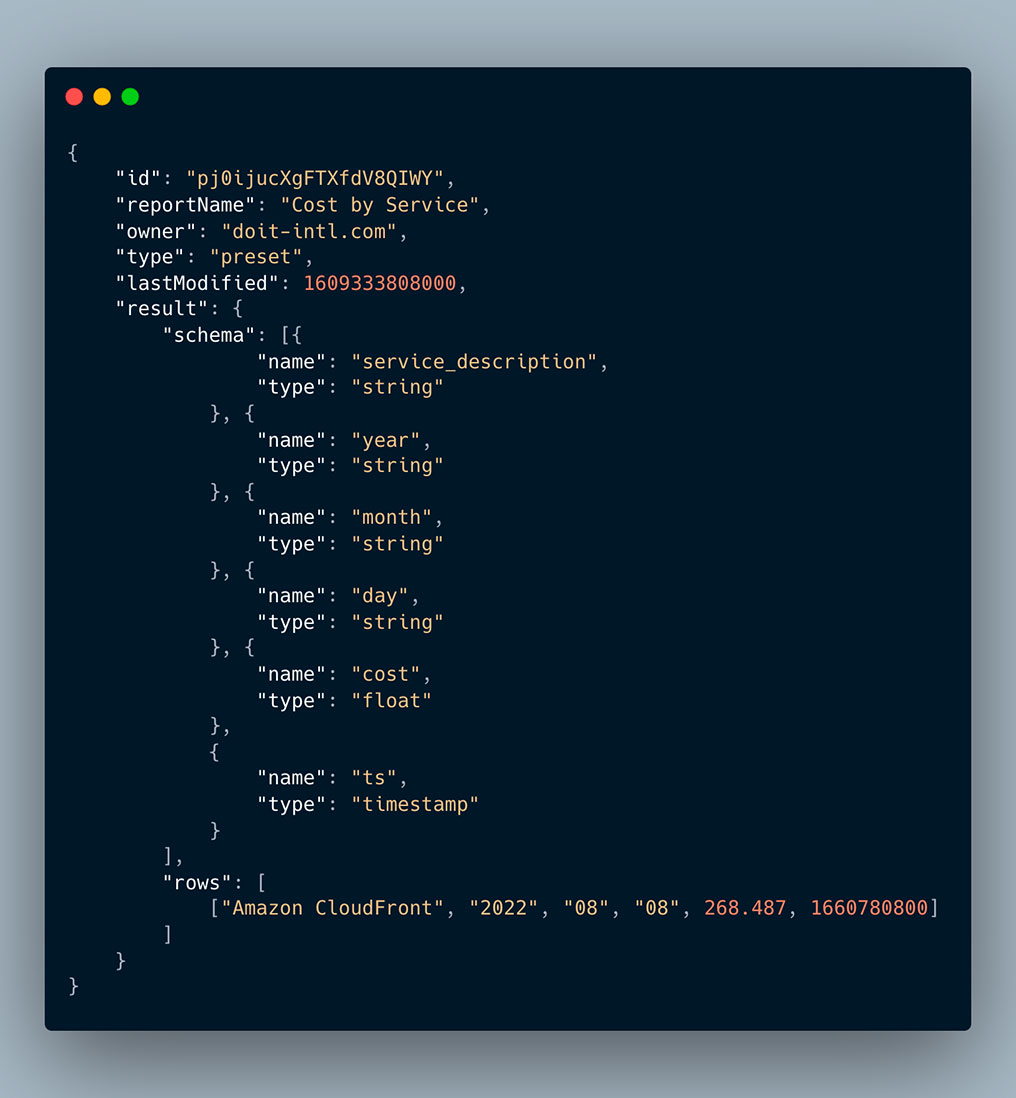
The "result" part of the JSON has two parts, - "schema" and the "rows". The first provides metadata about the data structure, and the latter is the data itself.
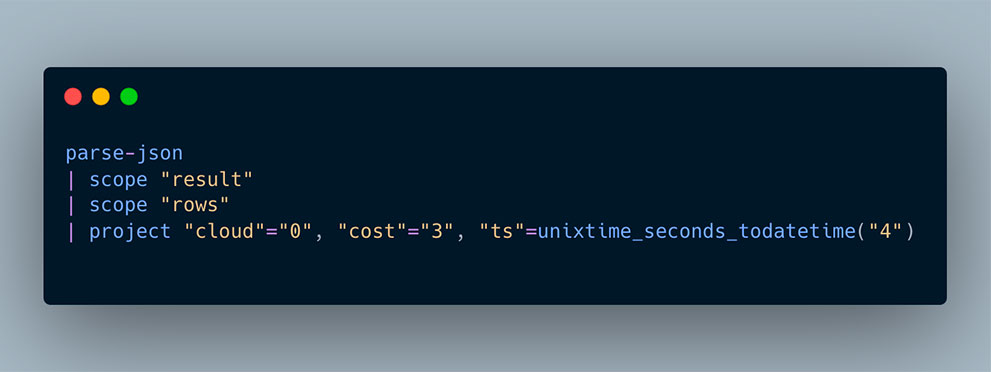
Since Grafana doesn’t know how to read the “schema” of the report, I am using the following UQL:
Step 5
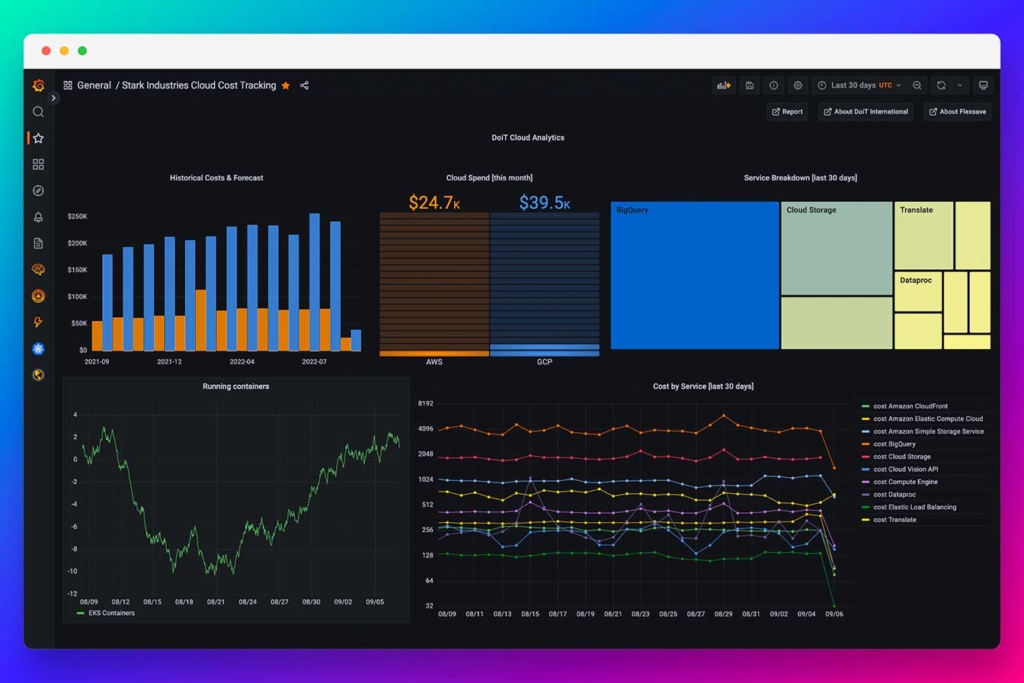
Select the desired visualization for your report (along with other panel parameters you’d like to use). Once you’re ready, you should be able to see your Cloud Analytics report in Grafana!
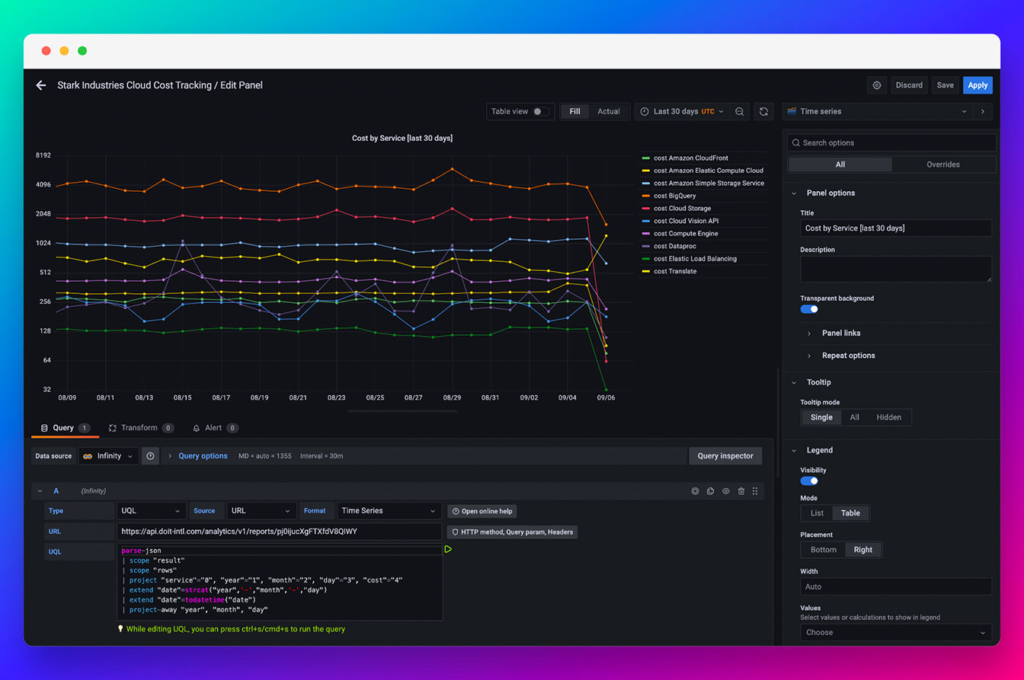
Let’s see those dashboards!
We hope you’ll find the integration of the Cloud Analytics plugin with Grafana just as valuable as we do, and we would love to see your dashboard! You’re welcome to send your dashboard screenshot/s to [email protected]. The top-voted dashboard will win you a $500 Amazon gift card.
Want more stories? Check out our blog, or follow Vadim on Twitter.