Using Databricks for data analytics? You can now connect Databricks to DoiT Cloud Intelligence and track detailed Databricks cost and usage alongside your infrastructure cloud cost and usage data.
After connecting your Databricks account(s), you’ll be able to explore your Databricks cost and usage in DoiT Cloud Intelligence™ in several ways.
Let's dive into the key ways you can leverage this integration.
Databricks Lens
The Databricks Lens is a ready-to-use dashboard created once you’ve integrated Databricks, providing an overview of your Databricks costs and usage with views into your DBU usage, cluster utilization, daily costs by job, and more.
While it gives you a head start in analyzing your Databricks, this is really just scratching the surface. Where it gets really interesting is when you leverage your Databricks data with other DoiT capabilities like Allocations, custom reports, Anomaly Detection, and more.
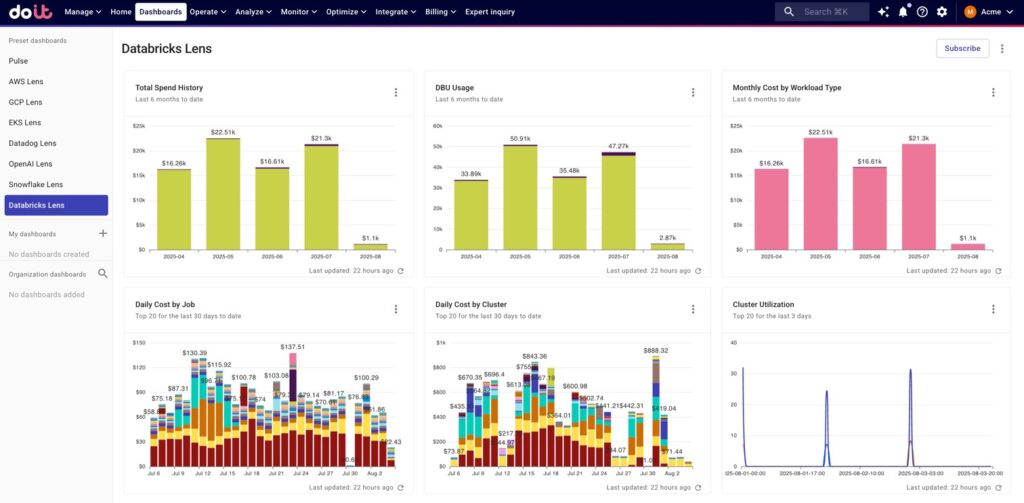
Databricks Lens in the DoiT console
Build Allocations with Databricks cost and usage data
Allocations are crucial for achieving true cost accountability and enabling accurate showback/chargeback across teams, projects, and business units.
With the integration setup, you’ll be able to incorporate detailed Databricks cost and usage data — via standard dimensions and/or system labels — in your Allocations.
These can be Databricks-only Allocations or existing Allocations that include data from other cloud(s) like AWS and/or integrated services like Datadog.
The more cost elements you can include in your allocations—from core cloud infrastructure to SaaS platforms like Datadog and OpenAI—the more complete and actionable your cost visibility becomes and the better you’ll understand the full economic impact of your technology investments.
In the example below, we created an Allocation (“Databricks environments”) that defines multiple Databricks environments — production and dev/QA — using data ingested through the Databricks integration.
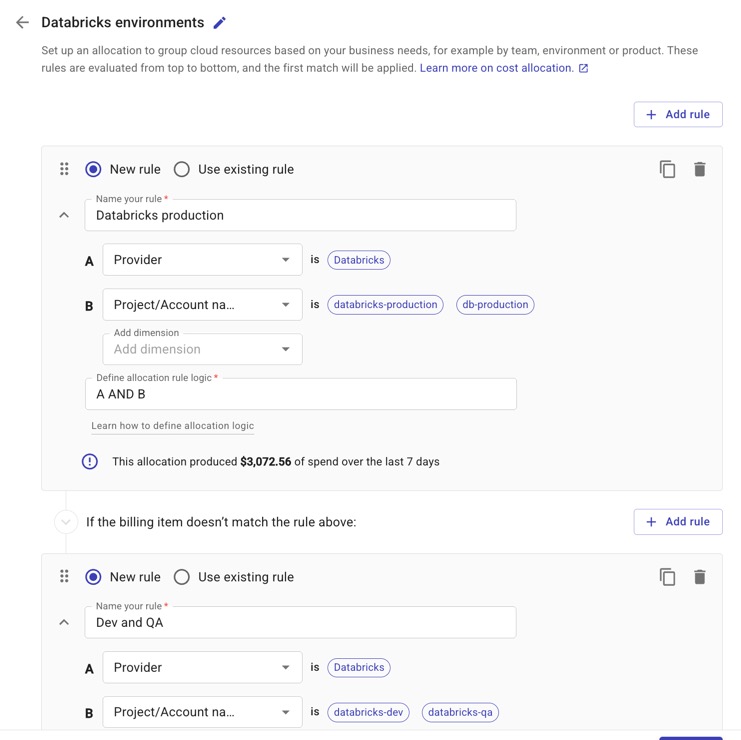
Allocations in the DoiT console representing different Databricks environments
Create cost and usage reports utilizing Databricks data
Using the same data mentioned in the section above, you can also build reports that help you understand your Databricks spend and usage.
For example, the best practice for running SQL workloads in Databricks is to use serverless compute.
In the report below, we can see — using the system label databricks/product_features/is_serverless — whether there are any SQL workloads running on non-serverless compute (“False” value in the first column).
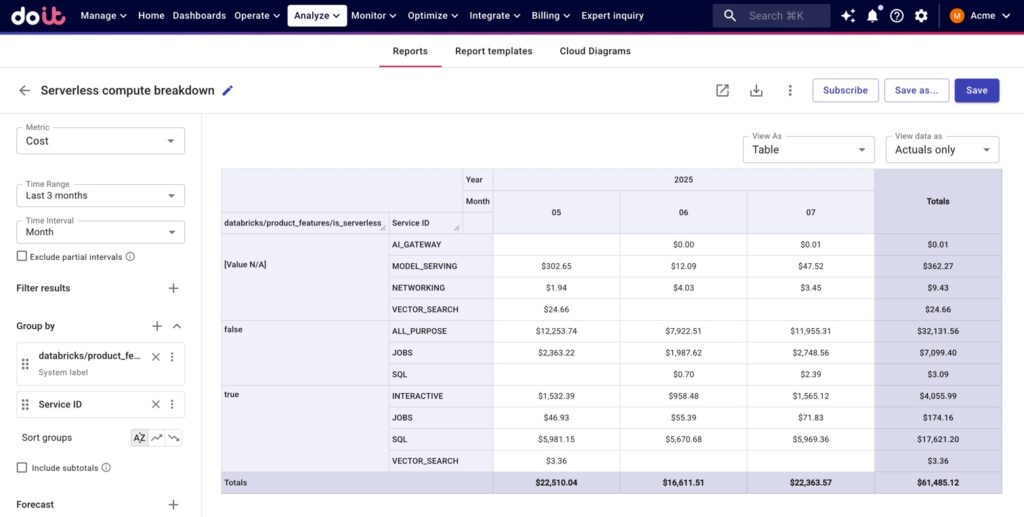
Report breaking down workloads running on serverless and non-serverless compute by workload type
If you see a significant cost amount next to “SQL” in the second column, you can then analyze which clusters are running on non-serverless compute by adding databricks/cluster_name in the Group by section to see which clusters need to be replaced with serverless compute.
Monitor and control your Databricks spending
Much like with other integrations we’ve released (ex. Datadog, OpenAI), if there’s an anomalous cost spike in Databricks, Anomaly Detection will pick it up and notify you, so you can take action before it impacts your bill and operations further.
Additionally, you can build Budgets using Allocations that incorporate Databricks data.
Remember those Allocations for our two types of Databricks environments we built above?
Below we’ve created a budget that monitors our Databricks production spend — defined by our “Databricks production” Allocation rule – against various spend thresholds.
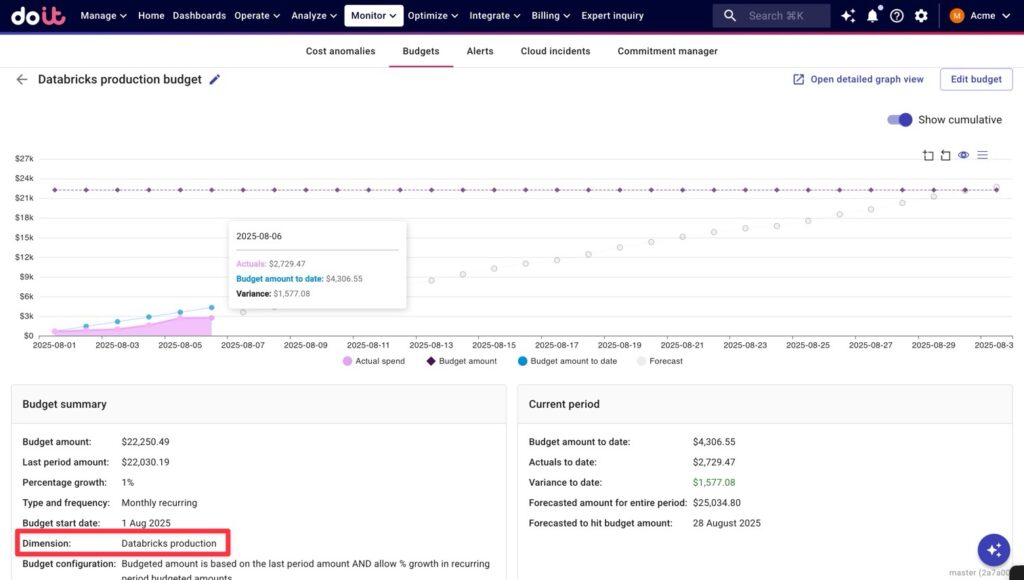
Budget in the DoiT console monitoring Databricks production costs
Another great use case (and complement to Budgets) is to set up Alerts monitoring your Databricks usage. Like with above, we’ve scoped this alert to our “Databricks production” Allocation rule.
This alert lets us know when month-over-month costs go up by more than 20% — but because we’ve included the system label databricks/cluster_name in the Evaluate for each dropdown, the alert will flag when any production cluster’s cost goes up by more than 20%.
While Budgets help you keep tabs on spend elements at a high-level, Alerts help you monitor multiple instances of a single dimension. In this case, instead of creating a Budget for every production cluster, we can just set up a single Alert.
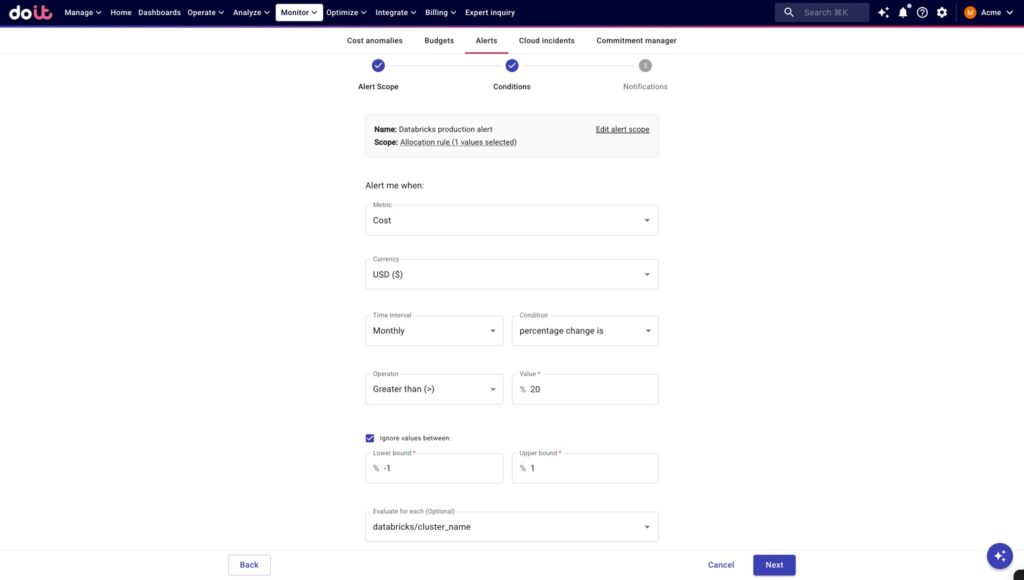
Alert monitoring for when any production cluster cost increases by >20%, month-over-month
Wrapping up
With your Databricks spend sitting right alongside your cloud infrastructure, other integrated SaaS costs like Datadog, and any other costs you've brought in through DataHub, you get a more complete cost picture.
And since your unit economics metrics are calculated using Allocations, incorporating Databricks data in your Allocations means your cost-per-customer, cost-per-transaction, and other business metrics will reflect the true, complete cost of your operations.
Ready to get started? If you're using Databricks, set up the integration today and start getting better visibility into your data platform costs. Not yet a DoiT customer? Get in touch with us to learn more about how DoiT Cloud Intelligence can help you maximize value from your cloud investments, not just reduce costs.
The Databricks integration is available for all the customers on the DoiT Cloud Intelligence Enhanced or Enterprise tiers, as well as on the DoiT Cloud Navigator Enhanced, Premium or Enterprise tiers.
To learn more about Databricks integration please check out our documentation in the DoiT Help Center or take the step-by-step tour of setting up the Databricks integration.