Cloud Diagrams automatically generates comprehensive infrastructure maps from your live cloud environment, providing both account/project-level architecture views and global network flow visualization.
It continuously scans your cloud resources to create always-current diagrams that integrate cost data, security context, and dependency relationships, so you don’t need to manually update documentation.
Automatically reflects infrastructure changes as they happen in your AWS accounts and Google Cloud projects
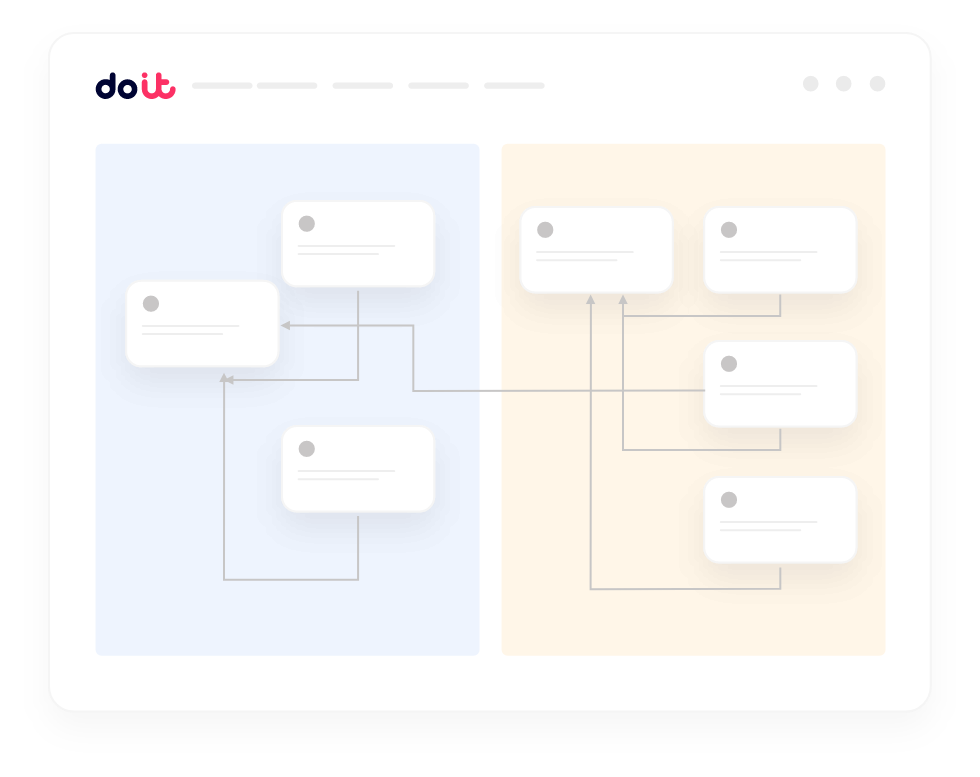
Cross-account network views
Visualizes network traffic and connectivity across multiple accounts/projects, VPCs, and regions
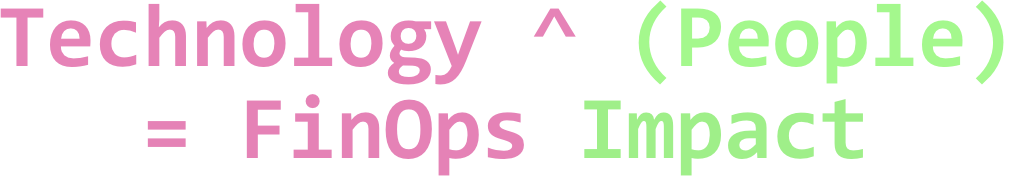
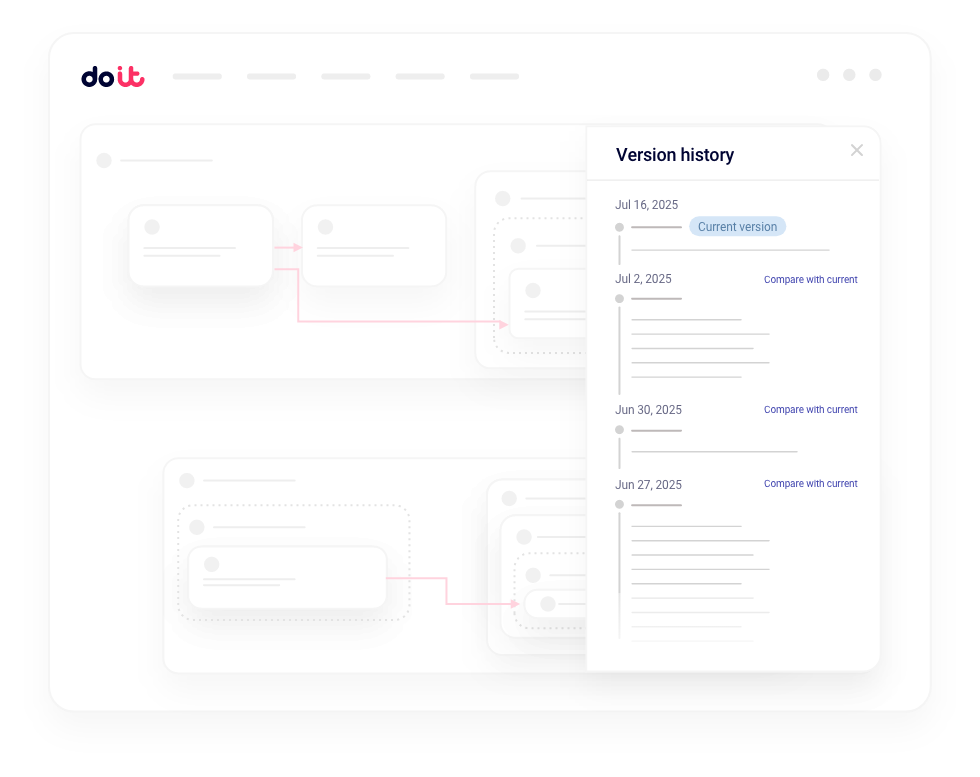
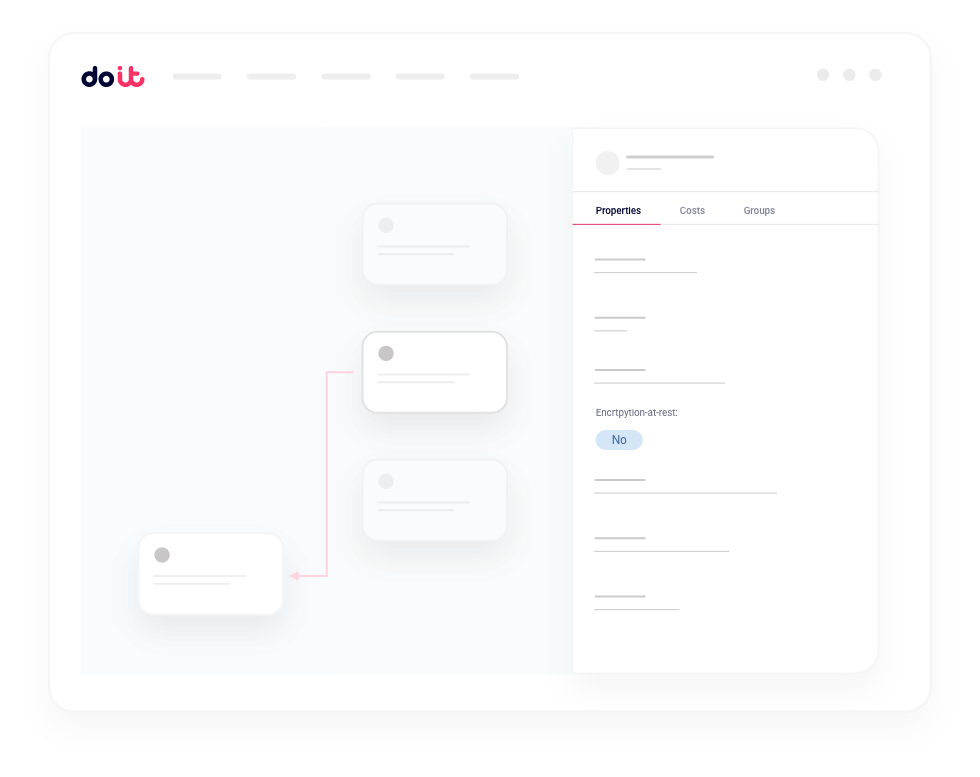
Cost and security context integration
Displays resource costs and highlights security risks directly in diagrams
Dependency tracking
Shows exactly how services connect so you know what gets impacted if you change something
Architectural context
that powers better decisions
Your infrastructure is changing at a faster pace than documentation updates can keep up with. And at the same time, optimization decisions are happening in isolation from their architectural impact. Cloud Diagrams bridges this gap with live infrastructure maps that give you the architectural and financial context needed to make business decisions.
Optimize infrastructure
without breaking dependencies
Cost optimization tools show potential savings but not what breaks if you change something. Cloud Diagrams reveals exactly what connects to expensive resources so you can optimize with confidence.
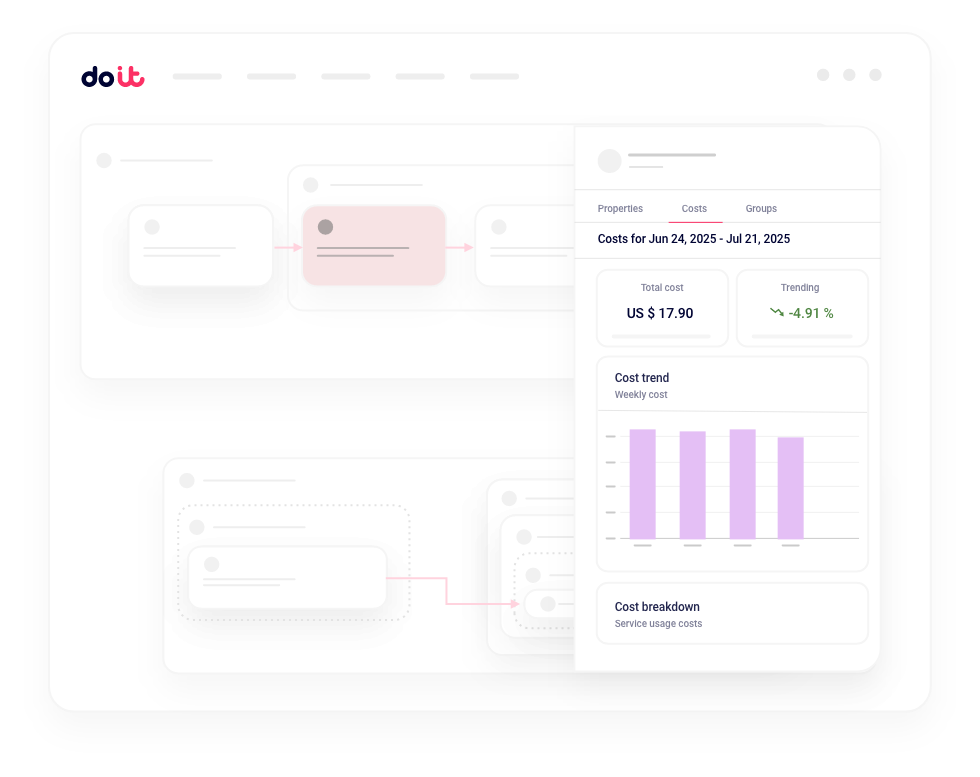
Documentation that updates itself automatically
Infrastructure documentation becomes obsolete the moment you update them, with one deployment rendering your diagrams inaccurate. Cloud Diagrams automatically reflects every change so your team always sees current architecture.
Troubleshoot network issues across VPCs, regions, and accounts
Network problems spanning multiple VPCs and regions require hours to diagnose. Cloud Diagrams maps network flows across your entire environment so you can trace connectivity issues immediately.
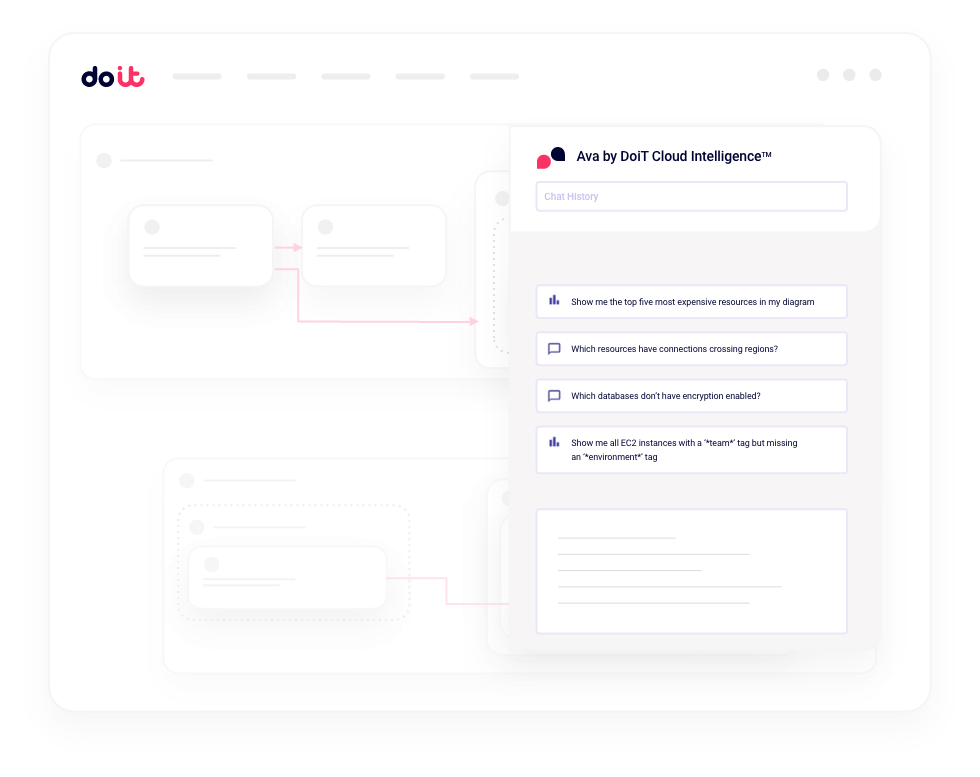
Query your infrastructure
with built-in AI
Ask questions about your infrastructure and get answers with cost, security, and architectural context baked in. Use AI to answer questions like “Which services have connections crossing region boundaries?” or “Show nodes where costs have increased by >20% in the last month” and see results highlighted in real time.
Visualize multicloud connections in one
unified view
Multicloud environments force teams to switch between different consoles and mental models to understand their complete architecture. Cloud Diagrams provides consistent visualization across AWS and Google Cloud so you can see your entire infrastructure landscape.
When teams need infrastructure context, it's nowhere to be found
As cloud environments grow, the architectural context teams need for critical decisions becomes scattered, outdated, or lost entirely.
Critical minutes are lost during incidents
Learn more
When production breaks, engineers scramble between outdated documentation and endless console tabs trying to understand how services connect.
New engineers take months to become productive
Learn more
Without current architectural context, new team members are forced to piece together infrastructure understanding from scattered wiki pages and static, years-old diagrams.
Cost optimization decisions are made without architectural context
Learn more
Teams make conservative optimization choices or delay cost-saving changes because piecing together resource dependencies requires navigating through multiple cloud console screens. Without a complete view of architectural impact, cost decisions become risky guesswork.
Knowledge becomes tribal and fragmented
Learn more
Critical infrastructure understanding lives in individual team members' heads, creating single points of failure and making scaling teams nearly impossible when key people leave or go on vacation.
Explore Cloud Diagrams yourself
Take a self-service tour to experience how DoiT customers visualize their cloud infrastructure in real-time.
DoiT Cloud Intelligence™ is the only intent-aware FinOps platform that goes beyond cost optimization to drive reliability, performance, and security—turning endless “good ideas” into real, implemented solutions at scale—ensuring teams are 10X more likely to achieve business outcomes than with any other solution.


")