
We walk you through the easy-to-use Data Studio Dashboard DoiT has created to monitor BI Engine workloads
Monitoring your BI Engine workloads is difficult.
Google BI Engine is now generally available and is already used by a lot of DoiT customers. Customers use BI Engine with Looker but also on other BI Tools such as Tableau. At DoiT, we use BI Engine for our Advanced Cloud Cost Analytics platform to deliver sub-second queries to our customers.
However, when it comes to monitoring BI engine workloads, there is still some work to be done.
In the Cloud Monitoring Metric Explorer, you can see the Utilization of the BI engine reservation as well as the total Size of the BI engine reservation.
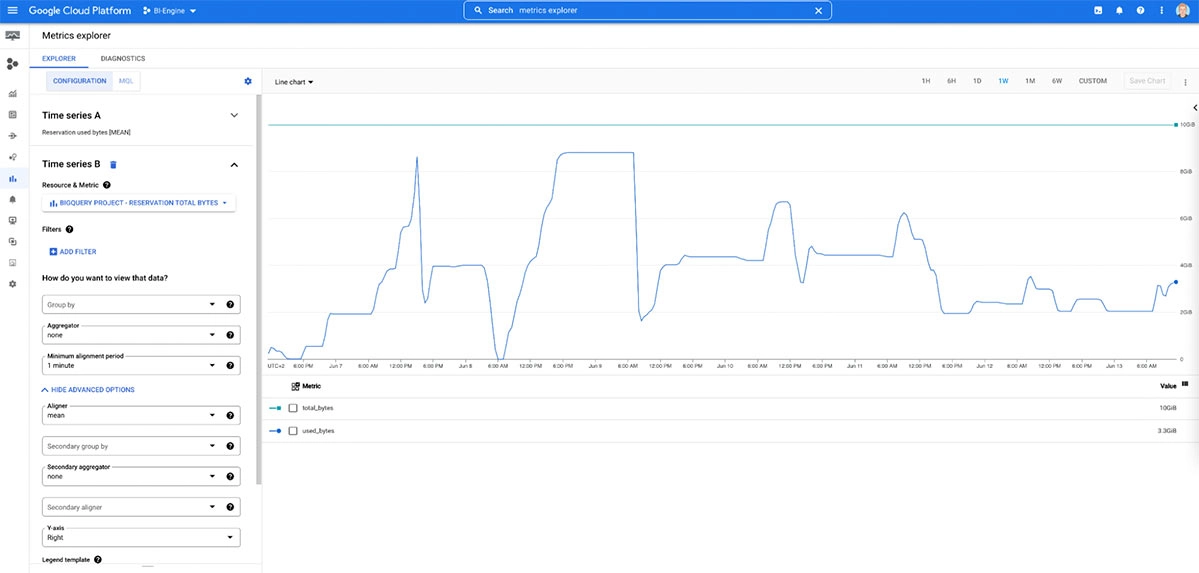
But this does not give insights about how many queries have been accelerated via BI Engine and, more importantly, why others did not get accelerated at all. There is also no dashboard within BI Engine or Cloud console to give you statistics on what went well and what did not.
At the time of writing, this information can only be queried from the Big Query Information Schema, specifically from the JOBS_BY_PROJECT table or via the Command Line (bq show --format=prettyjson -j job_id).
However, getting valuable insights needs some deeper understanding of the data as well as how BI engine works under the hood.
In response, we have created an easy-to-use Data Studio Dashboard to monitor BI Engine workloads.
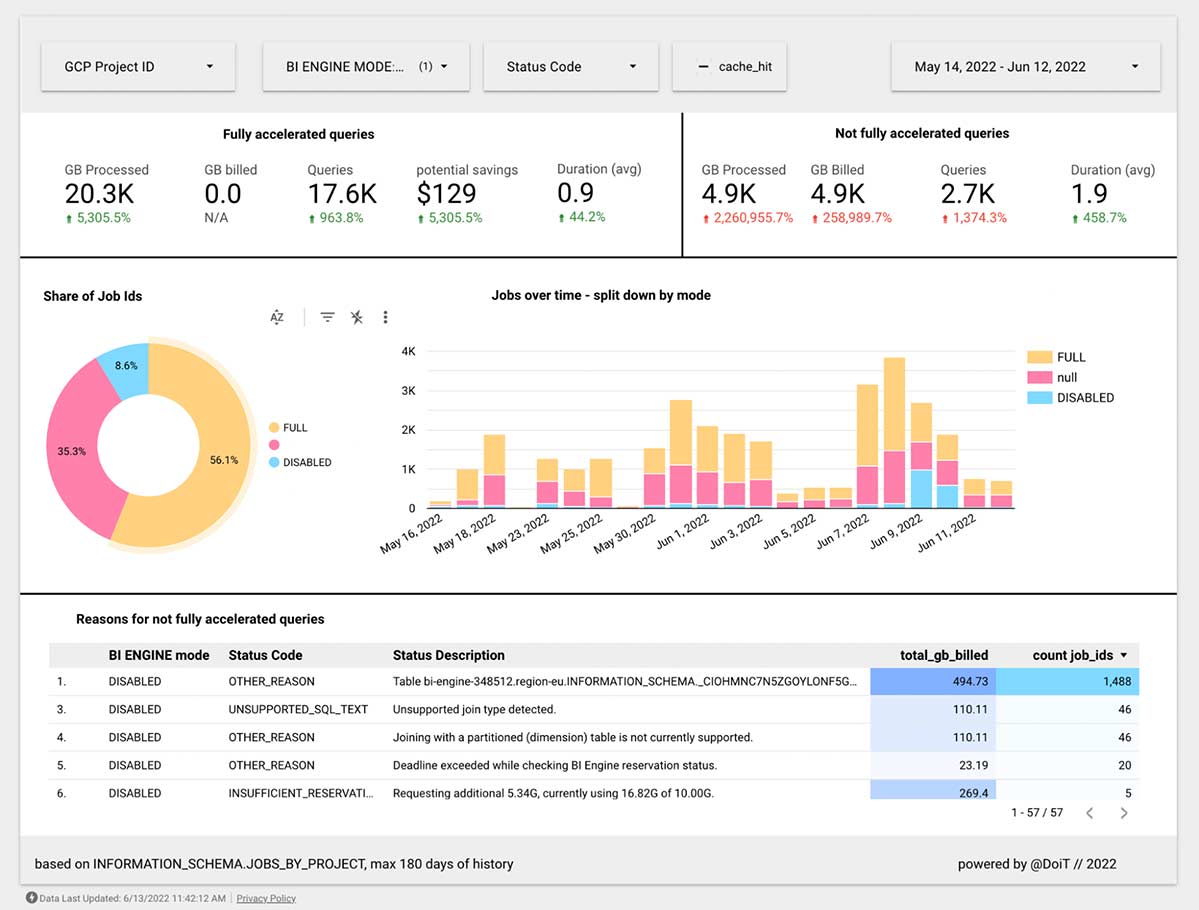
The query we used in this dashboard can be found here.
Getting started
Prerequisites
To create the dashboard and query the INFORMATION_SCHEMA tables a user must have access to the following INFORMATION_SCHEMA table:
- INFORMATION_SCHEMA.JOBS_BY_PROJECT
Datasource
1.1 Copy this datasource
Log in to Data Studio and create a copy of the following data source. More information on copying data sources can be found here. https://datastudio.google.com/datasources/d42dfc2c-71d4-46a3-ba38-bdd080e9472f
1.2 Set the correct GCP Billing project
Set this to the project, where you have made the BI Engine reservation
1.3 Change the data sources:
We used region-eu in our example, but you can change this to a region of your choice (where your BI Engine capacity is reserved). Use the following format to specify regionality for the project-id, region, and views in the INFORMATION_SCHEMA view:
`PROJECT_ID`.`region-REGION_NAME`.INFORMATION_SCHEMA.VIEW
Dashboard
2.1 Copy the dashboard
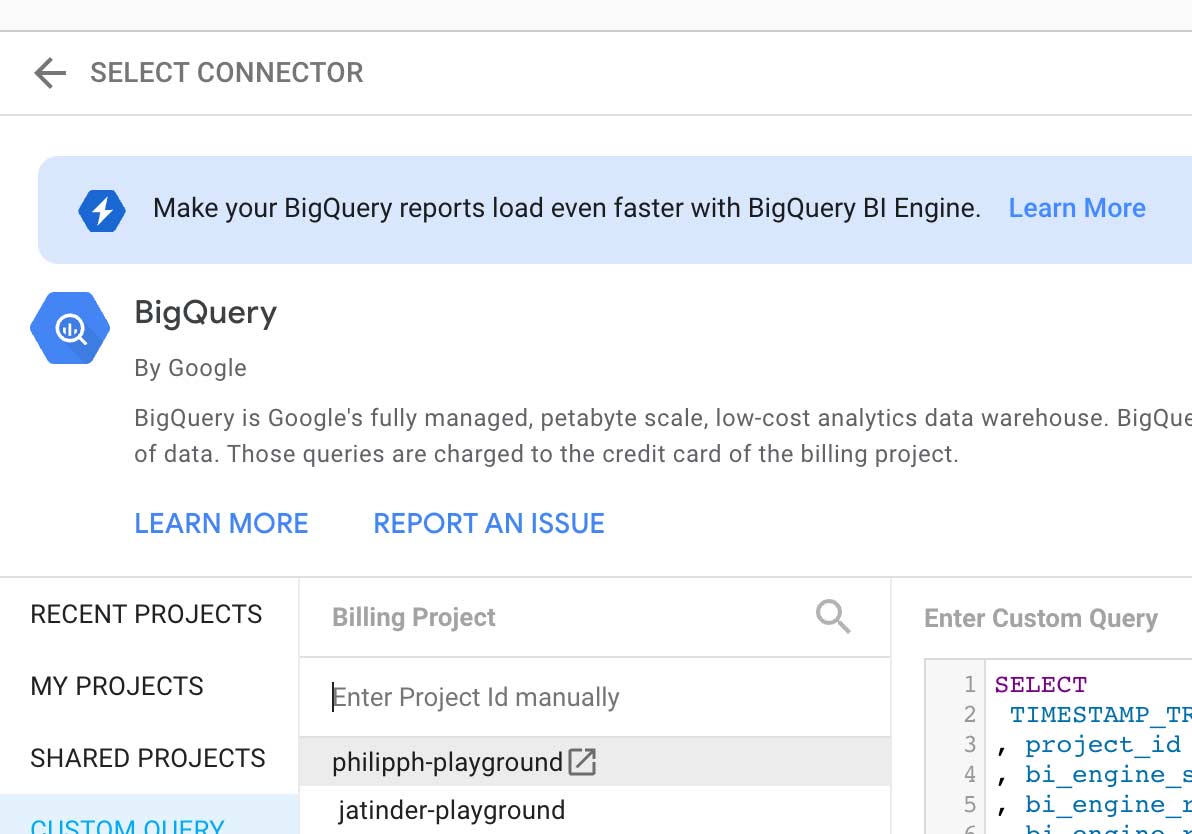
Create a copy of the public dashboard. You will be asked to select a new Datasource, you have to select the one you copied in step 1. Click on create report and rename it as desired.
2.2 Change the dashboard
Once the report is copied and all the data is rendered, change any date pickers in the report pages to use the period you desire (ex: last week, last 14 days, last 28 days, etc).
You are now set up to gain valuable insights into your BI engine workloads.