Datastore export costs don’t show up in Google Cloud Monitoring. Here’s how to set up real-time alerts to better keep track of export costs.
Google Cloud Datastore monitoring, available in GCP Operations (formerly Stackdriver) as well as the App Engine Dashboard, shows metrics for your Datastore operations, allowing you to track where cloud costs or infrastructure load comes from.

Or at least, mostly.
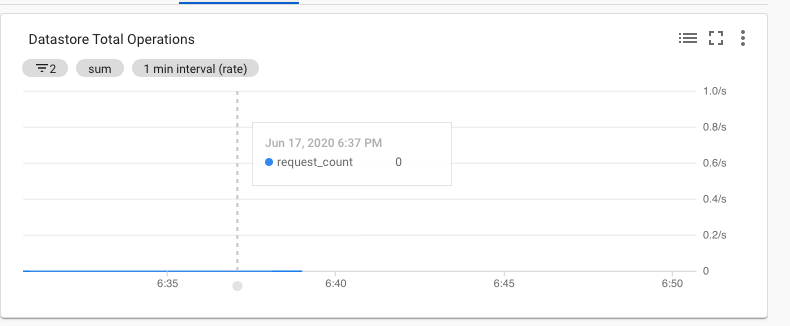
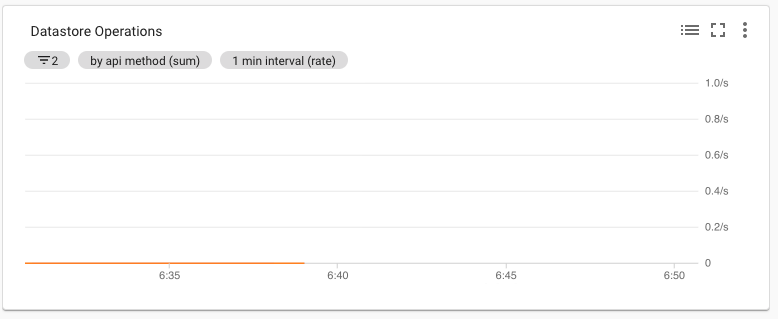
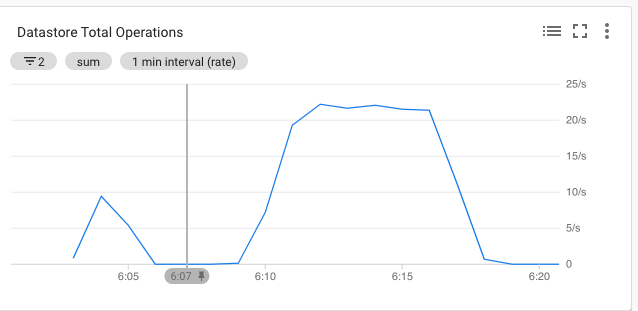
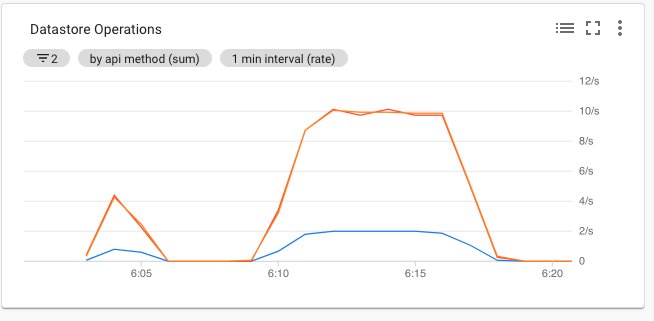
Read operations which are part of Datastore Export, are not reflected in the monitoring. You can see that in the two images to the left.
Compare these to the visualization in the dashboard for normal Datastore operations. (See the Appendix at the end of the post.)
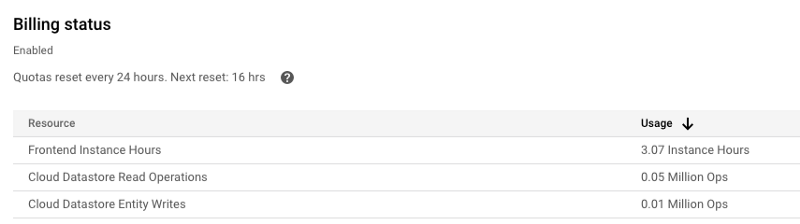
So, if you do a massive backup using Export, you will pay for, but not easily see the source of, the costs. Worse, since Exports are usually set up to run periodically, using a cron job or the equivalent, massive Exports may be happening frequently and without your knowledge.
You can track costs in GCP Billing or with reOptimize, but that lags by a day and does not show the precise source of the costs.
Set up real-time alerts for when Datastore is in use
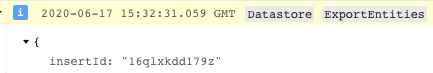
Instead, look for an ExportEntities entry in the GCP logs. Find it using this advanced Log Viewer filter (or go straight to it here).
https://gist.github.com/JoshuaFox/20419549c002838b1e76f4bddfd9840b#file-log-filter-to-see-export
You can even set up an alert on this log query to remind you that your Datastore is in (potentially massive) use.
The steps to do this are just the usual ones for a Log-based Metric.
- Go to the Log Viewer query.
- Select “Create Metric”.
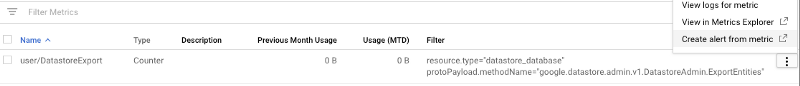
- Give it a name like
DatastoreExport, and leave the other default values (Counter Metric). Click “Create Metric.” You will now be taken to the Metrics page. - Click the three vertical dots on the far right of your metric as in this screenshot, and choose “Create alert from metric.”
You may have to close the condition panel now, as the auto-filled values are buggy (and show an error indication).
- Give your alerting policy a name, for example,
exporting-alert. - Click “Add Condition” to (again) open the condition panel.
- Give a Target of your new log-based metric (
logging/user/DatastoreExport), and a trigger condition of “is above 0”. Click “Add”.
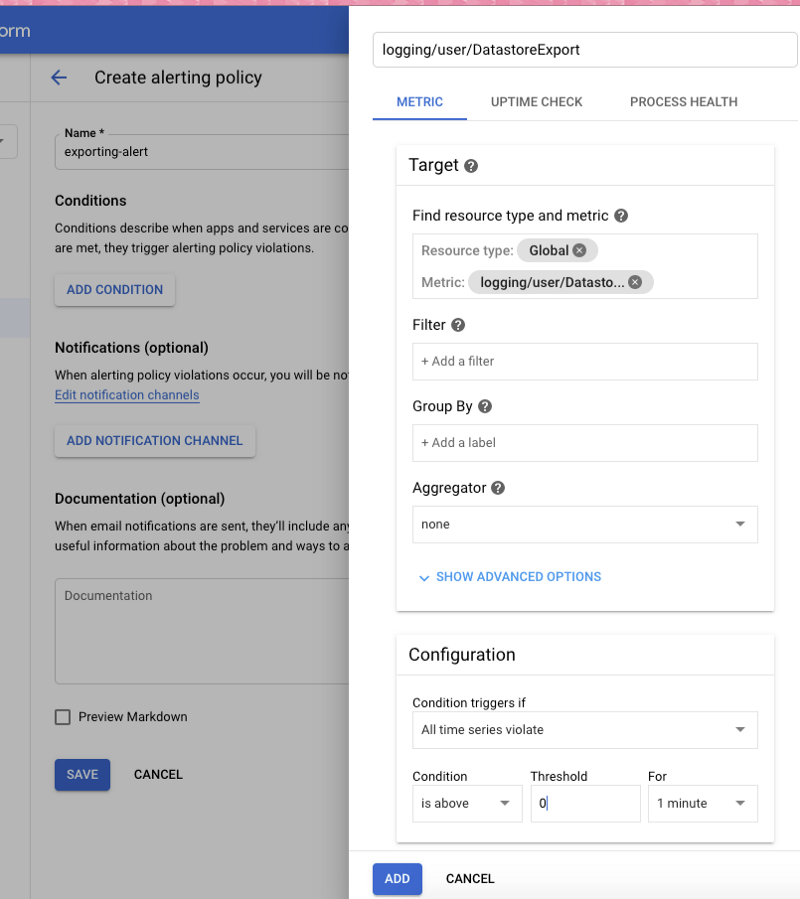
- Click “Add notification channel,” choose “Email”, and enter your address, and click “Add.”
You will now get an email when Export runs.
Appendix
These dashboard images show the normal operation of Monitoring — Datastore operations are correctly presented.