
At DoiT International, we work with a variety of software companies around the globe. We frequently receive requests to solve similar problems from multiple customers. Recently, I witnessed several cases where organizations wanted to ship their logs from multiple Google Cloud Platform (GCP) projects into a single project for centralized access and observation.
A lot of companies ship their logs to third-party providers like Datadog, Splunk, and others; but in this post, I’ll illustrate how to accomplish log-file unification with access control using GCP’s Cloud Logging service (formerly Stackdriver) alone. The result is a simple and elegant solution to an emerging common need.
Architecture
TL;DR
For this example, I will create two test projects and configure their logs to ship to a central project. As an added bonus, I’ll show how to centralize monitoring and metrics as well (another common use case).
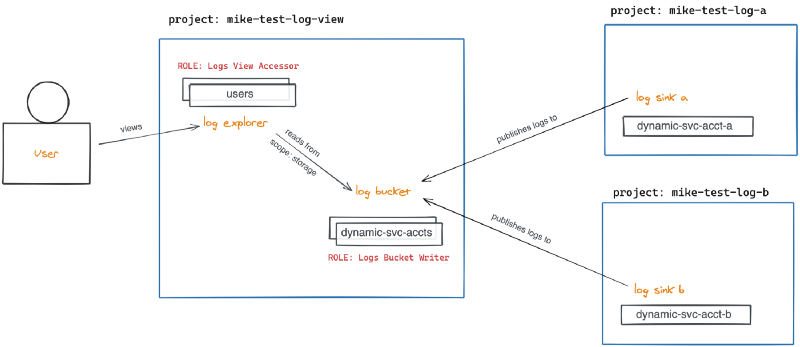
- Create three test projects on GCP, mike-test-log-view, mike-test-log-a, and mike-test-log-b
- Create a logs bucket in project mike-test-log-view and copy the path to the bucket
- Create a log sink of type Cloud Logging bucket, pointing to the path copied in step 2 for both projects mike-test-log-a and mike-test-log-b
- View details for each log sink and copy the writer entity Service Account email address (dynamically created for each)
- Edit the IAM roles in project mike-test-log-view and add each Service Account copied from the log sinks, granting the Logs Bucket Writer role to ach
- Edit the IAM roles in project mike-test-log-view and add the role Logs View Accessor with condition pointing to the path of your logs bucket (to restrict access by user)
- View the Logs Explorer page and click “Refine Scope” at the top, selecting “Scope by storage” and selecting your logs bucket
Step By Step
The following steps illustrate how you can ship logs from multiple Google Cloud Platform projects to a single centralized project.
Step 1: Create test projects
This step is self-explanatory. I created three projects as described above for demo purposes.
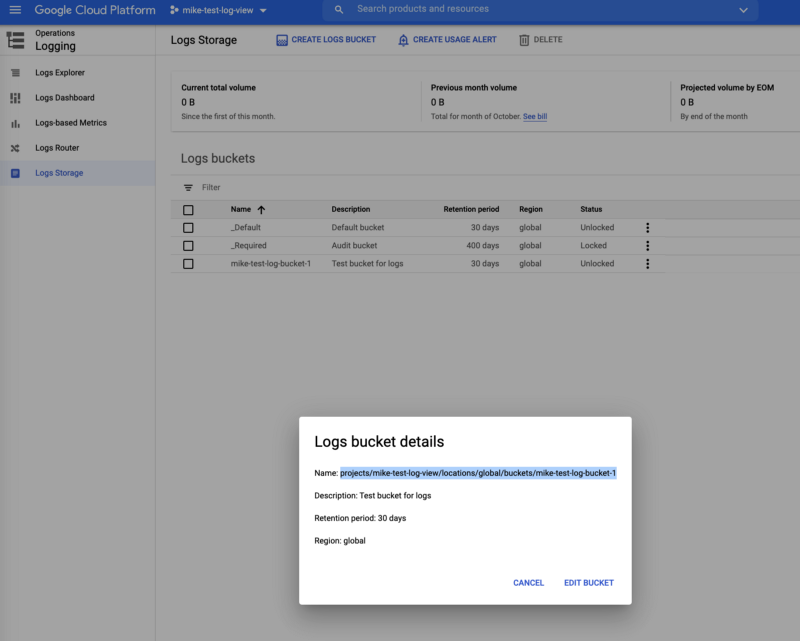
Step 2: Create logs bucket in view project
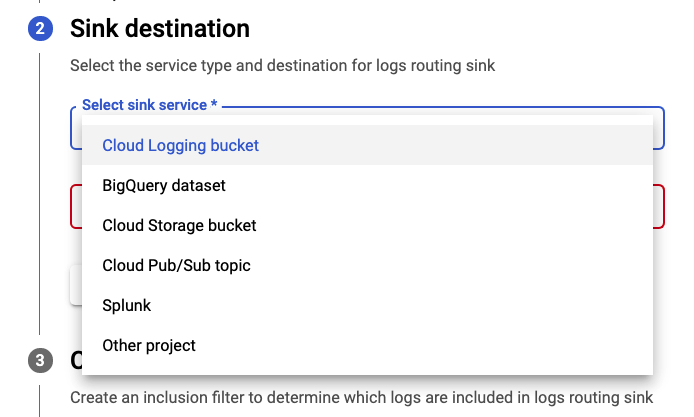
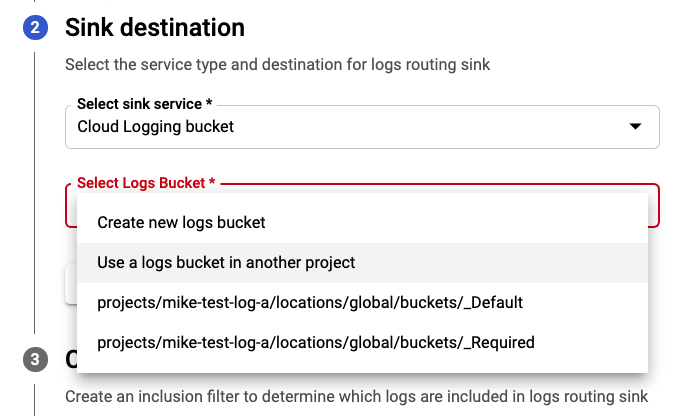
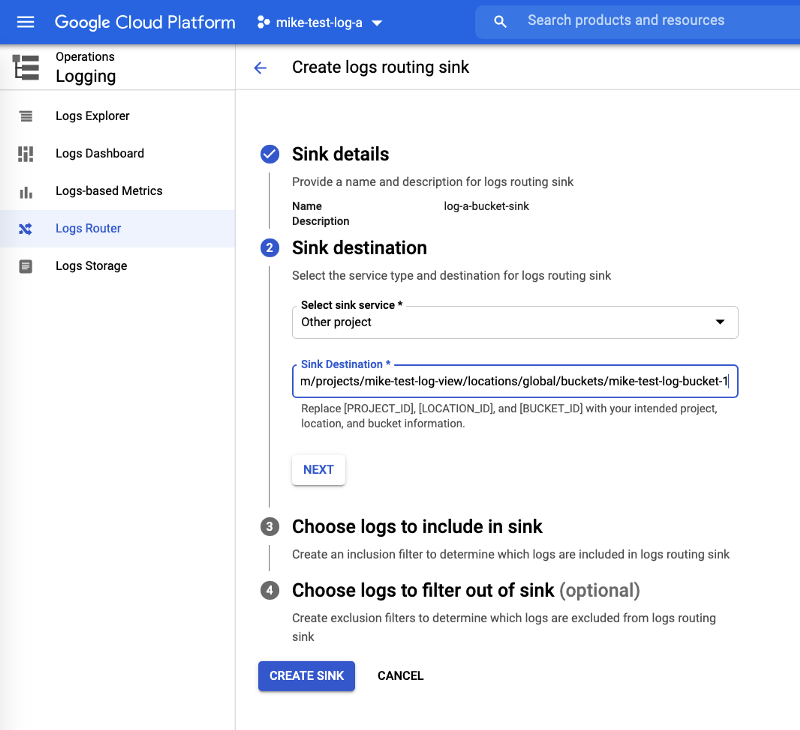
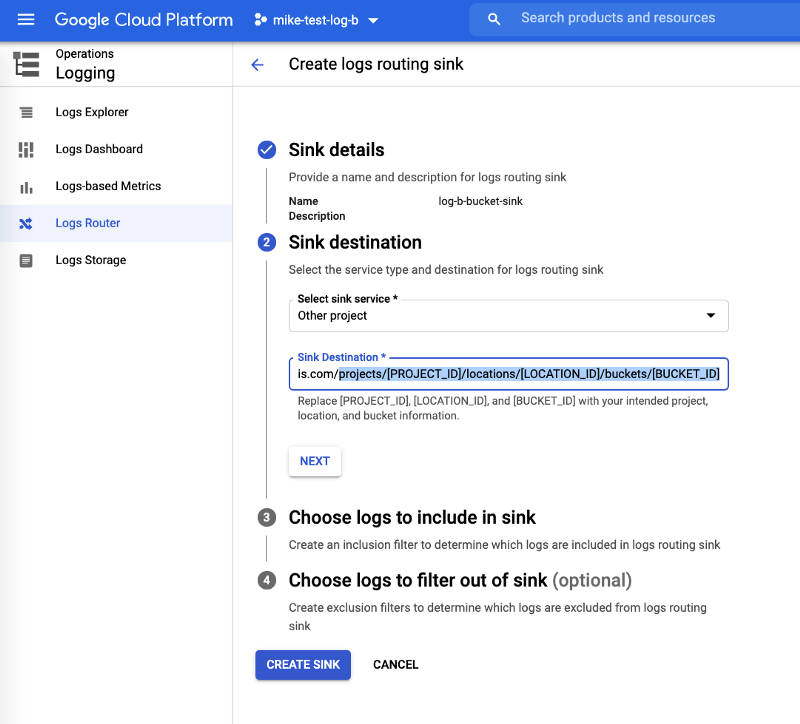
Step 3: Create log sinks in test projects
Create the log sinks in the test projects a and b respectively.
Step 4: View details for log sinks and note IAM writer identity
For each test project, in the list view of the “Log Router Sinks” page click the “…” (3 dots) at the far right of the row corresponding to your new log sink and select “View Details”.
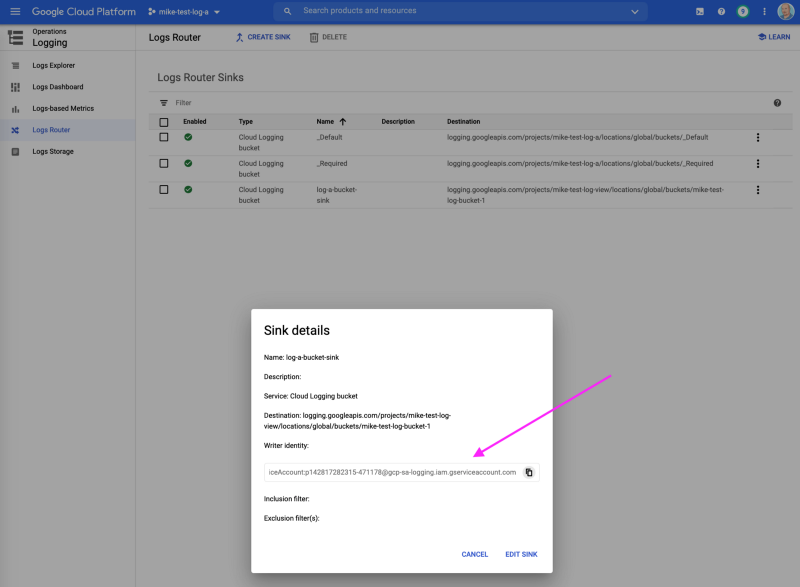
Copy the “Writer identity” which is the service account dynamically created with the log sink. You will add this to the view project to allow it to write log entries to your central logs bucket.
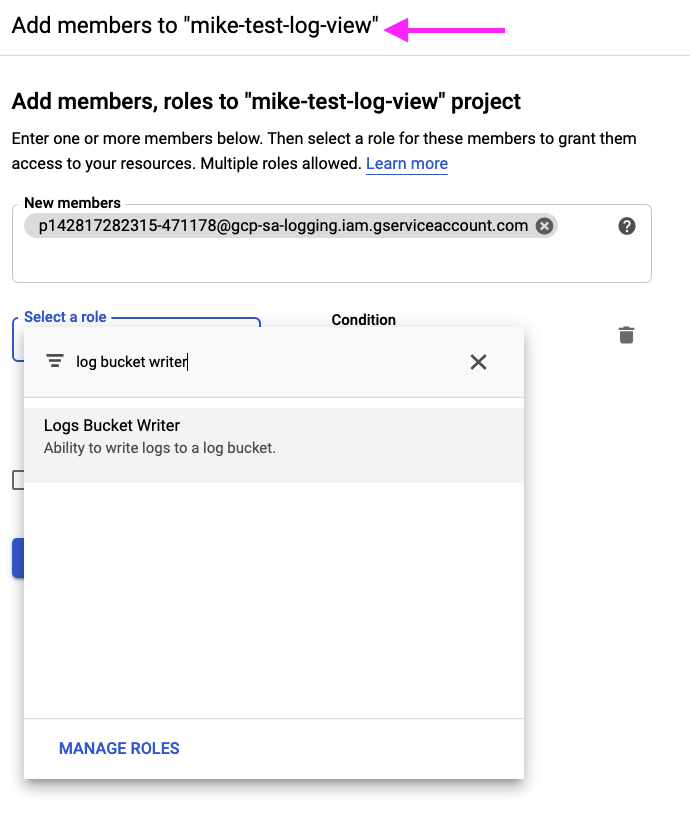
Step 5: Edit IAM roles in view project for log sink writers
For each log sink, in your central view project, visit the IAM administration page and add a member with the Logs Bucket Writer role using the copied “Writer identity” service account from step 4 as shown.
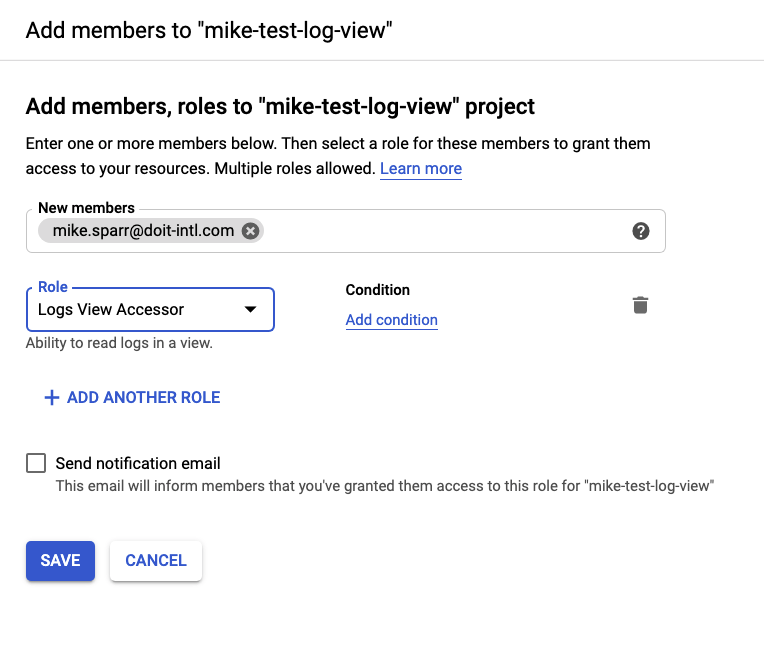
Step 6: Edit IAM roles in view project for log viewers (users)
In order for users to view the logs in the Logs Explorer, you need to grant them the ability to edit the view (or scope) by granting them the Logs View Accessor role.
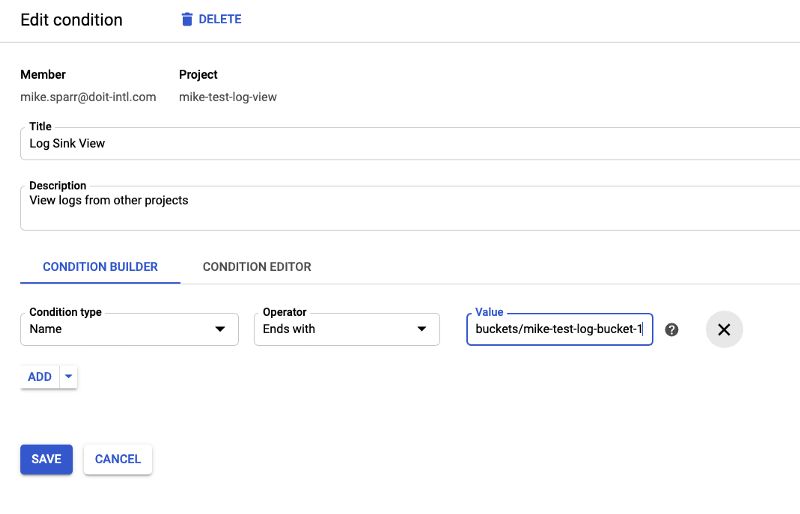
You can (and should) add further granularity to the user IAM role by adding a condition restricting access to only desired resources. In this case, it’s the path to the logs bucket you created. This allows you to restrict users’ view to only the logs and buckets you desire, useful for compliance controls.
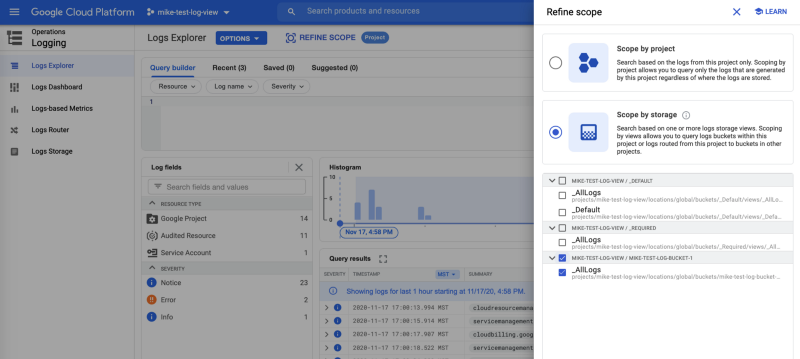
Step 7: View the logs
With the permissions in place, within minutes or less, you should begin to see log entries from your view project. You must first “Refine Scope” and select the desired logs source as shown.
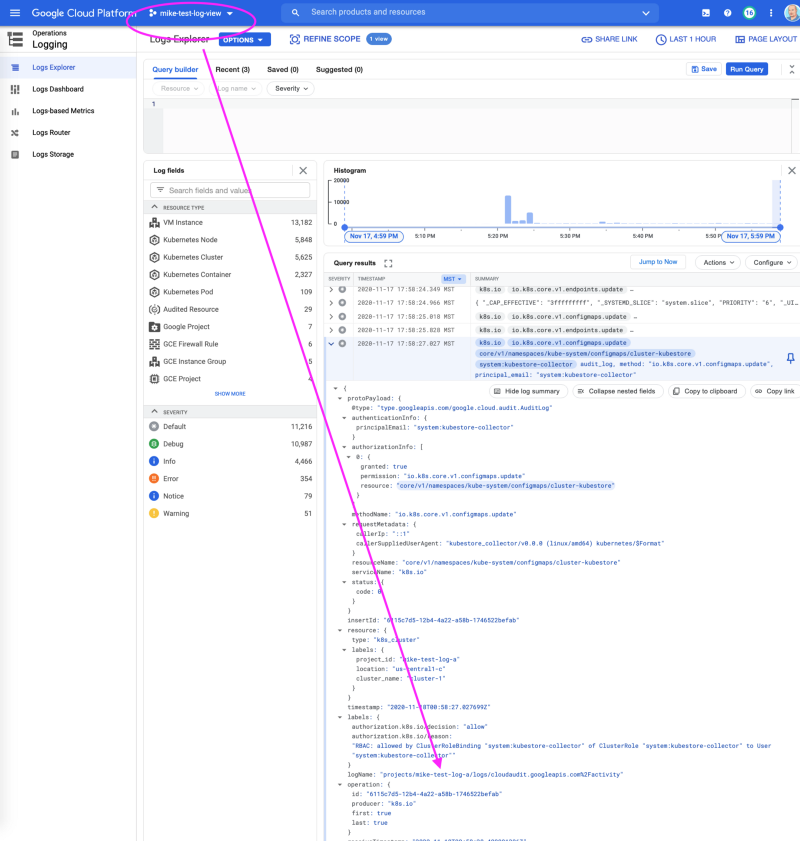
Congratulations! From your view project, you now can view logs from other projects as shown.
Bonus #1: Reduce costs with exclusion filters
You can disable your “_Default” log sink on your projects to avoid paying for logging in multiple locations.
You may also add exclusion filters (or inclusion filters) in your log sinks to control which services they ship and which they filter out.
- Managing logs exclusions
- Tip: The “rate” field is a sampling rate, so change it to 100 (%)
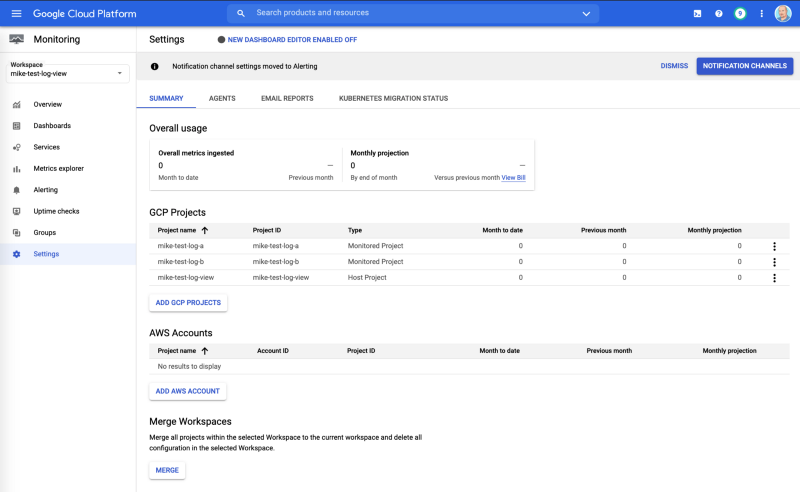
Bonus #2: Centralize your Cloud Monitoring
Google Cloud Operations (formerly Stackdriver) is a full-featured observability platform which, in addition to logging, includes another tool called Cloud Monitoring.
In a few clicks you can create a “Workspace” in your view project, and then select your other projects to centralize your monitoring and dashboards if you desire.
Summary
Hopefully, this article helps you better organize and manage your logging and observability across your organization. Follow me or view the DoiT Blog for more articles on tips & techniques, new features, best practices, and more for the public cloud.