
Cloud Intelligence™
What is an eBPF sensor?
This page is also available in Deutsch, Español, Français, Italiano, 日本語, and Português.


About Josh Palmer
Head of Content
I'm Josh Palmer, Head of Content at DoiT, where I split my time across multiple business units including DoiT Cloud Intelligence, PerfectScale (Kubernetes cost optimization), and SELECT (Snowflake, Databricks, and BigQuery cost optimization). Before DoiT, I spent four and a half years at OnBoard building content for a board intelligence platform used by 6,000+ organizations, and before that, two years as Content Marketing Manager at Zylo, a SaaS management platform.
My personal pageIf you've researched AI cost attribution or cloud observability tools, you've likely run into the term eBPF. It shows up in security platforms, networking tools, performance monitors, and increasingly, in AI cost attribution. But what does it actually mean, and why does it matter for measuring AI spend?
eBPF, defined
eBPF stands for extended Berkeley Packet Filter. The name is a holdover from its origins (it started as a way to filter network packets), but the technology has grown into something far broader: a way to run small, sandboxed programs directly inside the Linux kernel, without modifying kernel source code or installing a kernel module.
In practical terms, eBPF lets software observe what's happening on a machine at the lowest level: every system call, every network packet, every process, every GPU interaction, as it happens. It does this safely. eBPF programs run in a verified, sandboxed environment, so they can't crash the kernel or introduce security holes. For a deeper technical walkthrough of the loader and verification architecture, the eBPF.io introduction is the most thorough public reference available.
An eBPF sensor is the piece of software that takes advantage of this capability. It's a lightweight program that attaches to kernel events and streams data about what it observes, typically to a collector or analysis layer running elsewhere. Think of it as a sensor embedded in the operating system itself, watching activity that no application-layer tool can see.
eBPF sensors versus kernel modules and agents
Before eBPF, getting this kind of visibility usually meant one of two things: writing a custom kernel module, or running a heavyweight agent that hooks into the application layer.
Kernel modules can see everything an eBPF sensor can, but they carry real risk. A bug in a kernel module can crash the entire machine, because the module runs with full, unchecked access to kernel memory. Modules also have to be rebuilt and tested against every kernel version, which creates an ongoing maintenance burden few teams want to own.
Application-layer agents avoid that risk, but they pay for it with blind spots. An agent installed inside an application can only see what that application chooses to expose. It can't see traffic moving through a shared GPU driver, a kernel network socket, or a process it was never told about.
An eBPF sensor sits in the middle, with the best properties of both. It runs inside the kernel, so it sees everything a kernel module would see, but every eBPF program passes through the kernel's verifier before it's allowed to run, so it can't crash the system or read memory it shouldn't. That combination, full visibility with bounded risk, is why eBPF has become the default choice for modern observability, security, and now, cost attribution tooling.
Why kernel-level observation matters
Most monitoring and attribution tools work at the application layer. They depend on something being instrumented: a tag on a resource, an SDK wrapped around an API call, a log line an engineer remembered to add. That works fine when the thing you're measuring is static and well-defined.
AI infrastructure isn't static or well-defined. This is exactly where traditional FinOps practices start to strain; see how FinOps adapts (and doesn't) for AI workloads for more on that shift. A shared GPU cluster serves multiple products at once. A managed model API account fields requests from dozens of teams. An LLM gateway aggregates traffic from agents, pipelines, and human users into a single outbound stream, often stripping out the caller's identity along the way. None of that activity carries a tag. None of it passes through an SDK you control.
An eBPF sensor doesn't need any of that. Because it operates inside the operating system, it sees the actual consumption directly: the process, the container, the pod, the GPU cycle, the token. It doesn't ask the application to report anything. It observes the system itself.
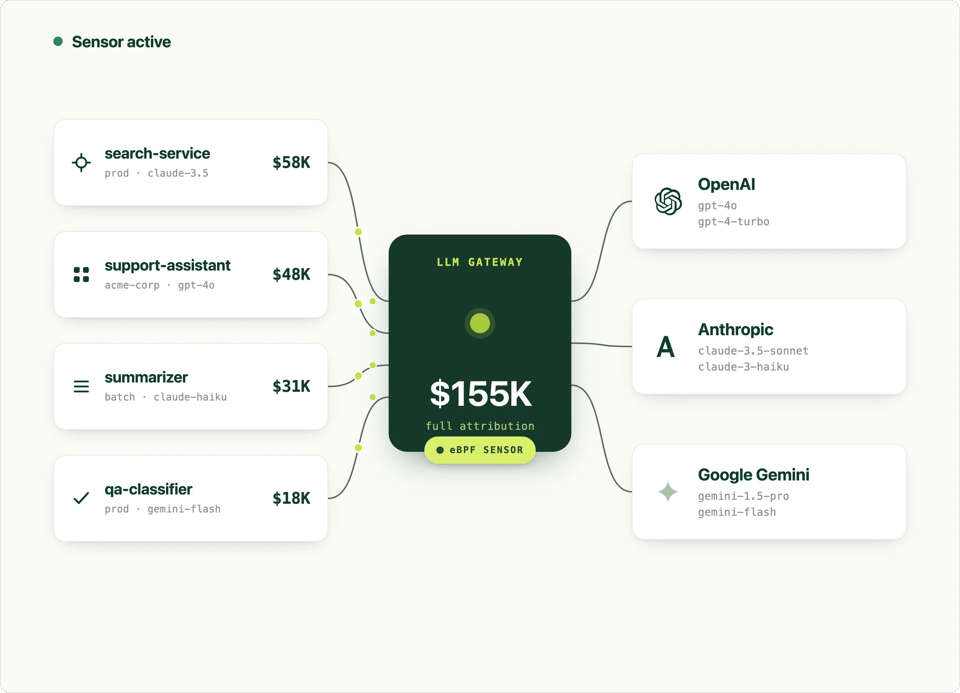
Consider a common scenario: an engineering team routes all model traffic through a single LLM gateway to manage rate limits and failover across providers. From the gateway's perspective, every request looks the same: one API key, one outbound stream. The billing statement from the model provider reflects that same flattening. There's no way to tell, from the bill alone, whether a given dollar came from a customer-facing feature, an internal automation, or a runaway test script. An eBPF sensor solves this by watching the traffic at the point it actually leaves the machine, before the gateway aggregates it, and tying each request back to the process that made it.
Cloud bill shouldn't be a mystery
One platform for AI and Cloud optimization.
How an eBPF sensor works, step by step
- Attachment. The sensor attaches to specific kernel events, things like system calls, network activity, or GPU scheduling, depending on what it's designed to observe.
- Capture. As those events occur, the sensor captures relevant data points: process IDs, resource usage, timing, and so on.
- Verification. Before any of this happens, the Linux kernel's eBPF verifier checks the program to confirm it's safe to run. This is what makes eBPF different from a traditional kernel module, which carries far more risk.
- Streaming. The sensor streams what it observes to a collection layer outside the kernel, where it can be joined with other data, like provider billing records.
- Mapping. That joined data gets mapped back to the workload responsible: which agent, which feature, which customer.
The entire process happens continuously and in real time, without requiring code changes, manifest edits, or instrumentation of any kind.
eBPF sensors and AI cost attribution
This is where eBPF becomes directly relevant to Tokenomics, the discipline of understanding what each token costs and what it's worth. AI workloads move too fast and too unpredictably for instrumentation-based attribution to keep up. An agent can spawn a thousand sub-agents overnight. By the time an engineering team has wrapped a new call pattern in an SDK, the bill has already landed.
An eBPF sensor sidesteps that problem entirely. Because it measures from inside the operating system, before any proxy, before any abstraction, before any ownership boundary, it captures every token, every model request, and every GPU cycle as it happens. That data can then be joined with provider billing from sources like Anthropic, OpenAI, Google Gemini, and AWS Bedrock, splitting out cached tokens, reasoning tokens, input tokens, and output tokens automatically.
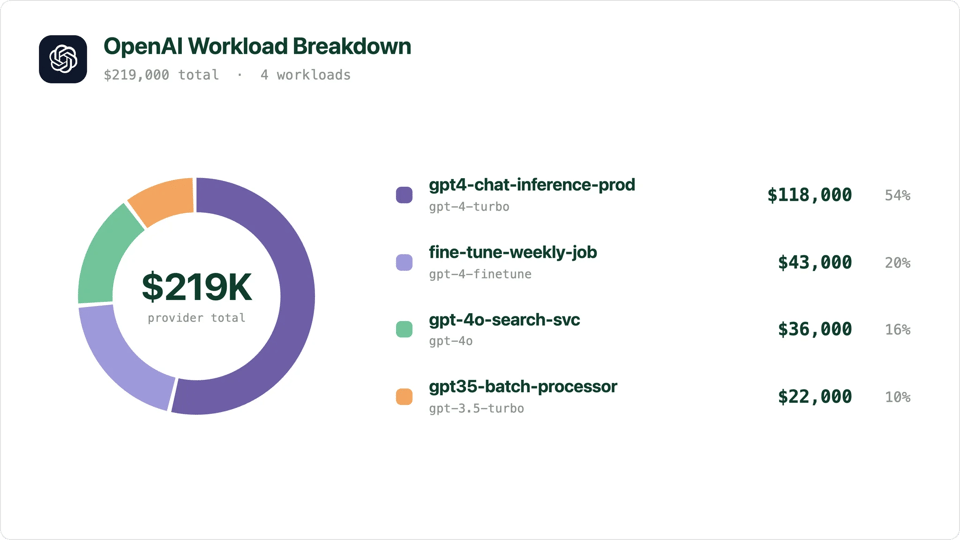
The result is attribution that doesn't depend on tags, SDKs, or code changes, deployed in minutes rather than months. That granularity is also the foundation for measuring AI ROI accurately. Without knowing what a feature actually costs, any ROI calculation is built on a guess.
Frequently asked questions
Is an eBPF sensor safe to run in production? Yes. Every eBPF program passes through the kernel's built-in verifier before it's allowed to load. The verifier checks that the program always terminates, doesn't read memory outside its bounds, and can't crash or destabilize the kernel. This is a fundamentally different risk profile than a traditional kernel module, which has unrestricted access and no built-in safety check.
Does an eBPF sensor require code changes or instrumentation? No. That's the core advantage. An eBPF sensor observes activity at the kernel level, so it doesn't need a tag, an SDK, or a code change to see what's happening. It works the same way regardless of how an application was written or which language it's in.
How long does it take to deploy an eBPF sensor? Deployment is typically measured in minutes, not weeks. Because there's no instrumentation step, no manifest changes, and no need to modify application code, a sensor can be installed and start observing traffic almost immediately. With Attribute™ by DoiT, most customers see attributed data within the same day.
Can an eBPF sensor see inside a shared GPU or LLM gateway? Yes, and this is precisely what makes it different from tagging or SDK-based approaches. Because the sensor observes traffic at the operating system level, before it passes through any gateway, proxy, or shared resource, it can trace activity back to the originating process even when that activity is aggregated or anonymized further downstream.
Does eBPF only work for networking and security use cases? No. eBPF started as a networking technology (the name stands for extended Berkeley Packet Filter), but it has since expanded into observability, security, and now cost attribution. Any use case that benefits from seeing system activity directly, without relying on the application to self-report, is a candidate for an eBPF-based approach.
What's the difference between an eBPF sensor and an eBPF program? An eBPF program is the underlying unit of code that runs inside the kernel, a small, verified piece of logic attached to a specific hook point. An eBPF sensor is the broader system built on top, including the collection and mapping logic that turns raw kernel observations into usable data.
That's the foundation Attribute™ by DoiT is built on. See what kernel-level AI cost attribution looks like in your own environment.


