New Cloud Diagrams updates: Isolate resources with Boolean/Regex filters, trace second-order dependencies, and better auditing of resource change history.
Infrastructure diagrams are often out of date the moment you hit “Save.”
And when your diagrams don’t match the reality of your architecture, every outage turns into a drawn-out investigation, onboarding becomes a game of guesswork for new engineers, and teams avoid optimization for fear of breaking something.
We built Cloud Diagrams to solve these problems by replacing static documentation and tribal knowledge with a live, automated source of truth for engineering teams.
Our latest release introduces four updates designed to provide deeper granularity into how your cloud resources connect to each other and how your infrastructure has changed over time.
Keep reading to learn more about all the updates to Cloud Diagrams and watch short demos.
Isolate resources with saved filters and advanced filter logic
Infrastructure diagrams can get crowded as your environment scales, making it hard to find what matters.
Cloud Diagrams Filters help you isolate resources in your diagram that match a specific criteria based on tags/labels and services. They're useful for when you’re hunting for a root cause during an incident or narrowing your view to the slice of a diagram your team is responsible for.
To give you more control when filtering a diagram, you can now use advanced logic and saved views to isolate your specific resources.
Switch contexts instantly with saved filters
Instead of rebuilding your filter criteria every time you open a diagram, you can now save and name them.
Then whenever you want to jump into a specific context all you’ll have to do is select the saved filter and click “Apply”
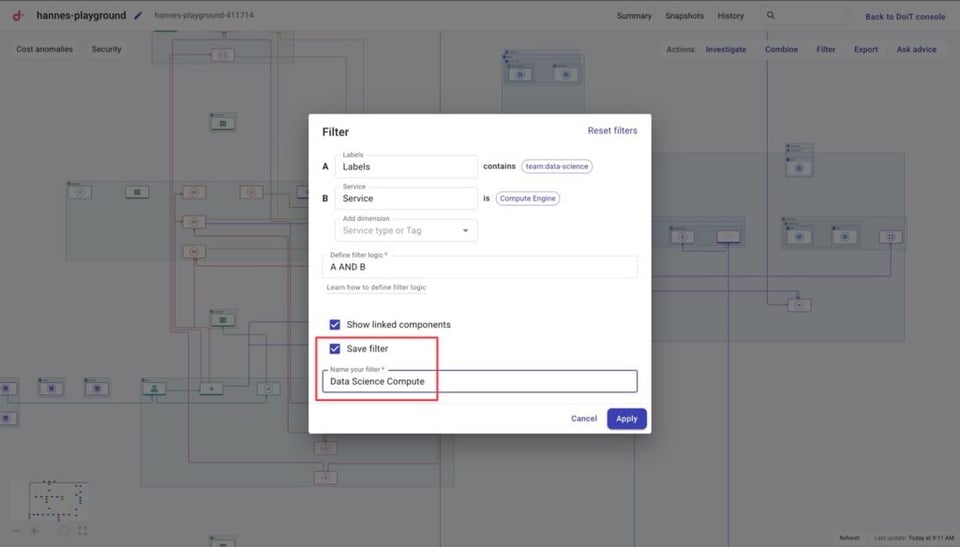
Build precise views with boolean logic and regex
You can now mix AND/OR logic and regex to create highly specific infrastructure maps. For example, you can filter for all resources tagged with a specific environment and team while excluding legacy testing instances using regex. This ensures that your diagram only displays the exact services and connections you are responsible for managing.
Watch the 2-minute demo video below to see these updates in action 👇
Trace the blast radius with enhanced Investigate mode
When a service fails or performance degrades, the issue is often not the resource itself but a dependency several layers away. Investigate mode isolating a resource and its dependencies so you can:
- Trace root causes of cost spikes or performance bottlenecks.
- Analyze the impact of planned infrastructure modifications before you deploy.
- Audit security reachability to identify over-permissive paths between resources.
We have upgraded investigate mode to give deeper visibility into your infrastructure’s interconnectedness so you can surface upstream and downstream connections faster.
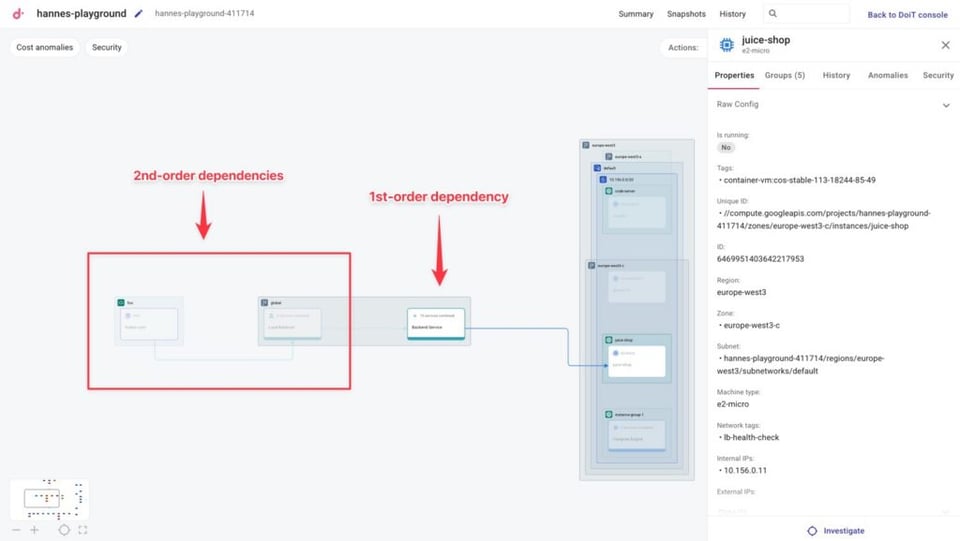
Visualize second-order dependencies
Investigate mode now allows you to see second-order dependencies. This means you can visualize both the direct connections to a resource and the next layer of connections beyond that.
This view is useful for assessing the blast radius of a performance alert or auditing your security posture before a deployment.
Find resources instantly with search to investigate
The new search-to-investigate feature allows you to enter the resource name, IP address, or any other unique identifier in the Investigate search bar to locate and isolate that resource and its dependencies.
This speeds up your troubleshooting workflow by providing a direct path to the starting point of your investigation.
See the Investigate mode updates in action by watching 1-minute demo below 👇
Improve cloud governance with granular change auditing
Maintaining a clear record of infrastructure changes is important for security audits, compliance, and general troubleshooting. Cloud Diagrams’ Version History helps you keep track of these changes by logging every creation, update, or deletion made to resources in your diagram.
And now, navigating infrastructure changes across large environments is now simplified with grouped service views and resource-specific timelines.
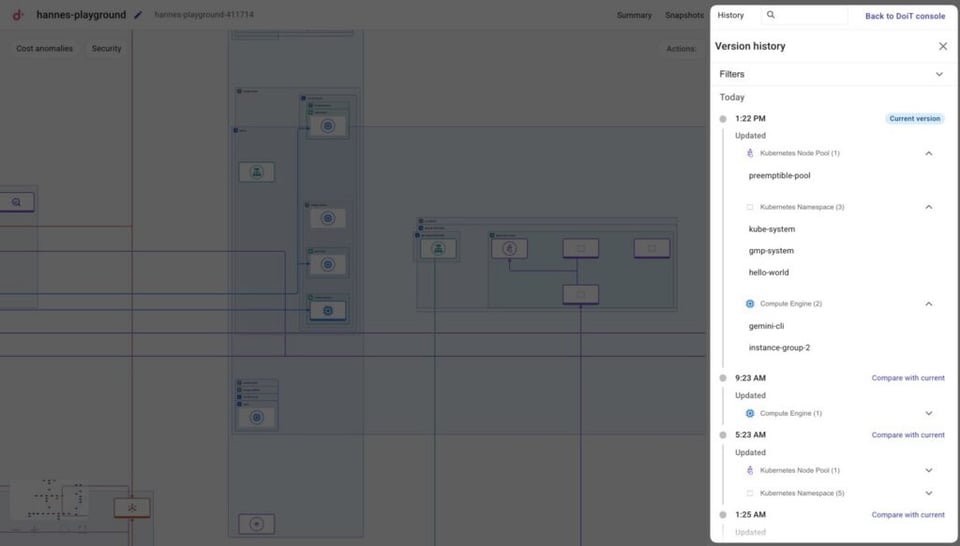
Audit changes by service, tags, and labels
To help you find specific modifications in large environments, changes are now categorized by cloud service (ex. Compute Engine).
You can expand these groups to see specific resources that were changed, and then click a resource name to go to it directly in your diagram.
Additionally, if you want to isolate modifications for specific environments, teams, and more, you can also filter your version history by tags or labels.
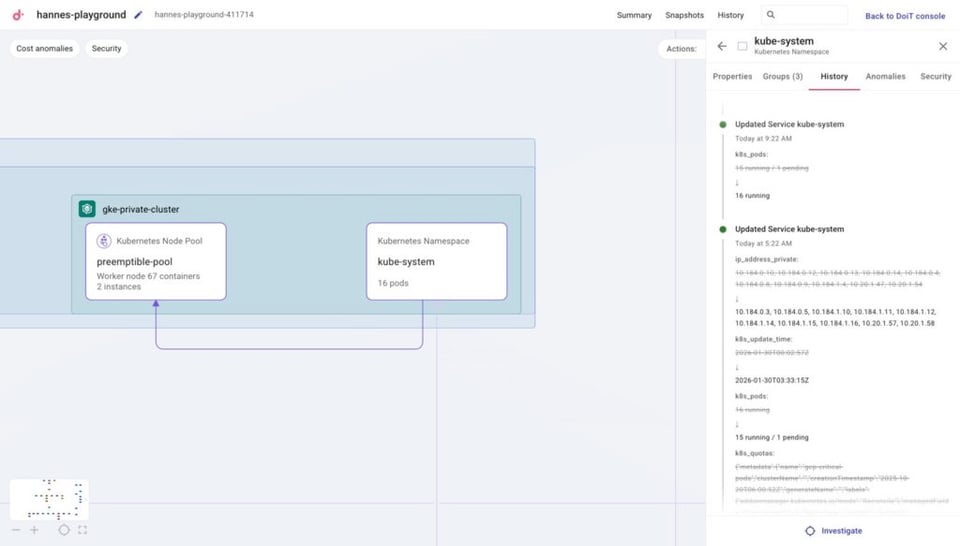
Track granular changes with in-resource timelines
When you select a resource in your diagram, a new History tab in the properties panel provides a dedicated timeline of every modification made to that specific resource.
This allows you to see specific attribute changes, such as IP address or cluster count changes, without leaving your diagram view. This chronological record is an essential tool for internal audits and post-mortem incident reports.
Check out all the updates to change auditing in Cloud Diagrams in the video below 👇
Expanded resource coverage for Google Cloud and AWS
To provide a more complete view of your environment, we have added support for eight new cloud resources:
| Cloud Provider | Newly Supported Resources | Example use case for SREs and Developers |
| Amazon Web Services | RDS proxies | Verify traffic routing between your applications and RDS instances via the intermediate proxy layer. |
| Amazon Web Services | RDS clusters | See the direct connections between your database nodes to understand your failover and scaling setup. |
| Google Cloud | Pub/Sub | Visualize topics, subscriptions, and message flows between services and event triggers. |
| Google Cloud | Google Kubernetes Engine namespaces | Trace network paths between GKE namespaces and other resources like load balancers to clearly understand traffic flow and service connectivity. |
| Google Cloud | Filestore instances | Track storage connections to see which instances or clusters are mounted to your file shares. |
| Google Cloud | BigQuery datasets | Map data dependencies to clearly see which services and projects interact with your BQ datasets. |
| Google Cloud | Firewall rules | Validate security boundaries and troubleshoot connectivity by visualizing how firewall rules allow or block traffic between instances and external services. |
| Google Cloud | Service accounts | Keep track of what resources your service accounts have access to. |
The addition of these services will help you build a more comprehensive map of your environment while surfacing critical gaps in your infrastructure security.
For example, selecting a Google Cloud service account will highlight its connected resources and fades out the rest of the diagram to help you identify over-privileged accounts or unnecessary attack vectors.
This makes it easier to apply the principle of least privilege by splitting service accounts based on clear visual evidence of their reach. See how it works in the clip below.