


Recently released by DoiT International, BigQuery FinOps Dashboard is your Swiss army knife for highlighting inefficiencies in your Google BigQuery usage
“What exactly are we paying for? Can we optimize our BigQuery costs?”
These questions are asked frequently by IT managers when reviewing their Google BigQuery costs on their monthly invoices — and rightly so.
Google BigQuery is a powerful big data warehouse vital to many teams’ operations. As such, it is important to know exactly how it is being used. Without being careful about optimal resource usage, like everything else in the public domain, it can come at a high cost.
There are two main factors contributing to this risk:
- Analysts’ behavior
- The nature of their datasets, tables, and user setup.
To combat overspending in BigQuery today, teams do a combination of setting cost controls at various levels, encouraging their teams to follow BigQuery best practices, and monitoring resource usage. As far as monitoring goes, the four most popular ways to do so are:
- Exploring BigQuery Audit Logs
- Querying exported logs in BigQuery
- Querying INFORMATION_SCHEMA.JOBS_BY_* in BigQuery
- Using BigQuery Dashboard in Cloud Monitoring Console
However, getting insights of BigQuery resource usage is very time consuming since you will need to develop queries and set up everything (perhaps even a dashboard) on your own. You have to configure monitoring tools just right to tell you a story about your BQ usage. Also, it is usually difficult to enforce the BigQuery best practices across your team, especially when you do not exactly know what should be their focus and what they should improve on.
BigQuery FinOps Dashboard
Exclusively for DoiT International customers as part of our Cloud Management Platform, we are introducing the BigQuery FinOps Dashboard, the quickest way to shine some light on BigQuery inefficiencies.
These are the most important features of this tool:
- Zero Configuration — important info delivered to you in an accessible form
- Shift from birds-eye view to hawk-eyed granularity in a few clicks
- Actionable behavioral, query, and storage recommendations, customized to your team’s setup.
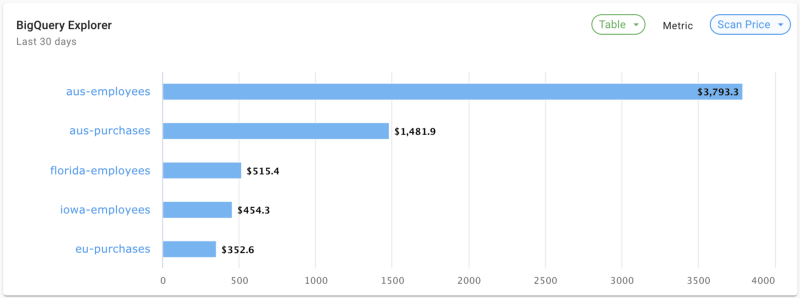
BigQuery Explorer
With the Explorer, you can analyze your top projects, datasets, tables, or users by scan or storage ($/TB):
… and get a more granular overview by clicking on a specific project/dataset/table/user you are interested in:
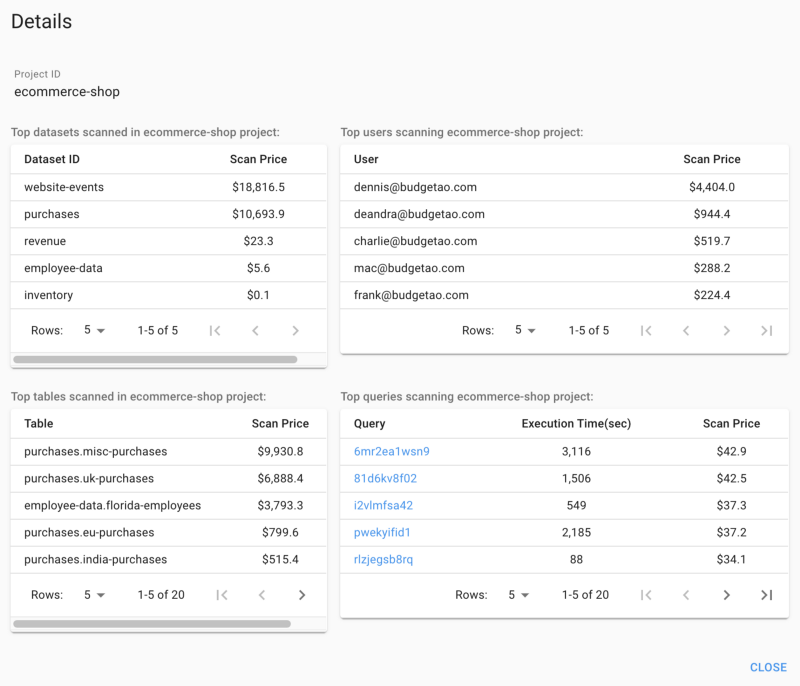
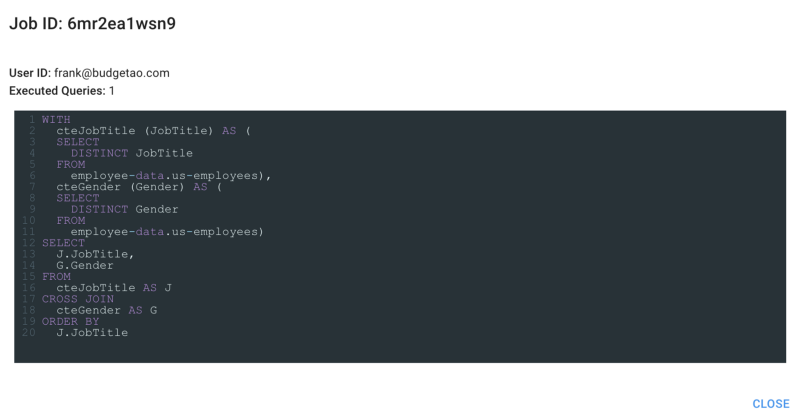
… and get even more granular by clicking on a selected job ID:
Actionable Recommendations
Warning: you might say “WOW” after reading the next section!
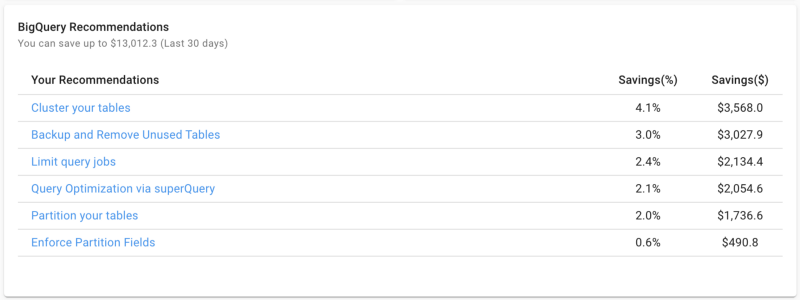
BigQuery FinOps Dashboard provides you with actionable recommendations to reduce your BigQuery costs based on the careful analysis of your usage. For each recommendation, we show you an estimate of how much you could save by implementing it.
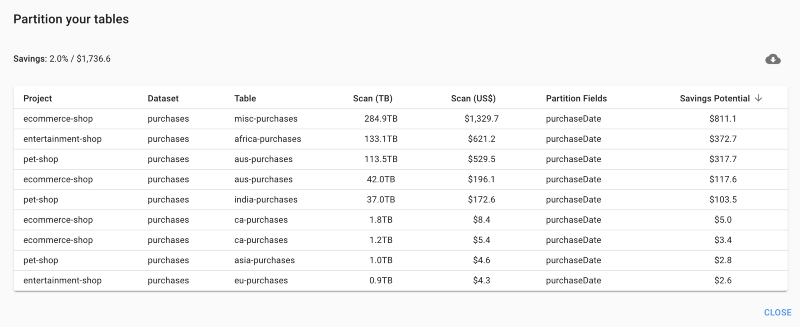
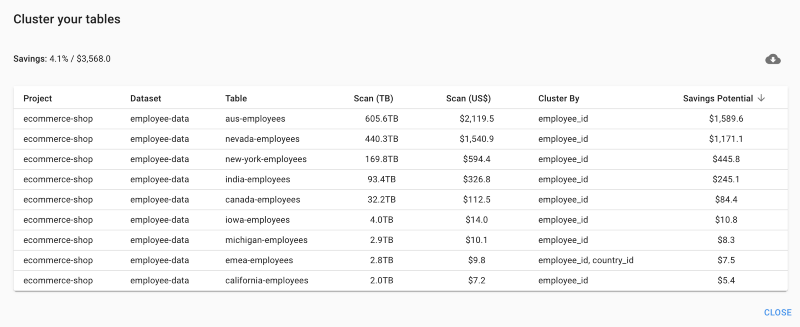
Cluster/Partition your tables
Every BigQuery user knows very well that clustering and partitioning gives you great performance and cost improvements. However, it is not very trivial to detect fields you could cluster/partition on in order to take advantage of these improvements, especially when you have multiple analysts running tons of queries.
With one click you can see an overview of your tables along with recommendations for clustering/partitioning fields. If you follow our suggestions and keep executing similar queries as were ran before, you can save money approximately up to the amount visible in the Savings Potential column.
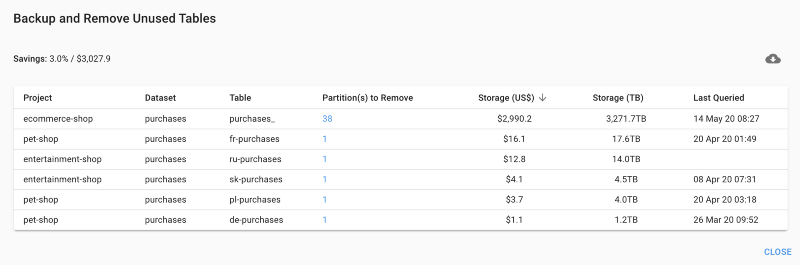
Backup and Remove Unused Tables
Why pay for tables you are not using anymore?! Have a look at the ones you have not been querying recently and the associated monthly cost of keeping them. Backup and remove, or pay — the choice is yours.
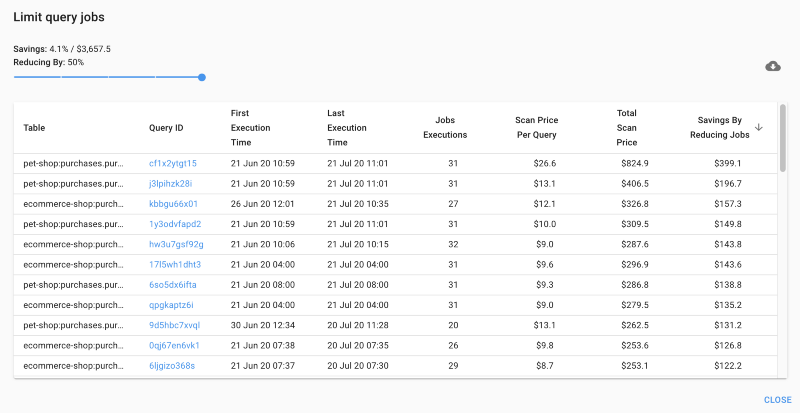
Limit query jobs
You might be running the same queries more than once, generating the same cost multiple times. Consider limiting query jobs and experiment with the slider to see your potential savings.
Query Optimization with superQuery
If you have not heard about superQuery yet, you should definitely check it out! superQuery is a powerful serverless IDE for many cloud-based databases such as Google BigQuery, AWS Athena, DynamoDB, and others. It has a query optimization engine that reduces cost and increases efficiency. BigQuery FinOps dashboard shows you how much you could save if you ran your queries via superQuery.
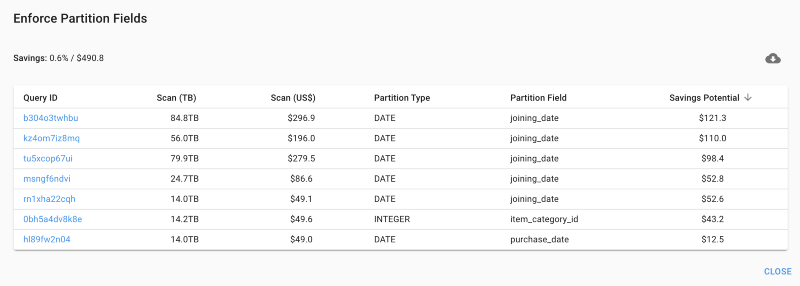
Enforce Partition Fields
Using partitioned fields in your queries may reduce the cost of your queries multiple times. We provide you with an overview of your top queries that do not use available partitions fields.
The BigQuery FinOps tools evolves with BigQuery, and customers can expect to receive recommendations following the latest technology released by Google.
What to do next
Want to identify and optimize your BigQuery weak spots?
Click here to schedule a demo with DoiT International today and gain access to the BigQuery FinOps Dashboard and other cloud optimization tools.
If you’re a DoiT International customer, I have good news: you already have access to your BigQuery FinOps Dashboard in your Cloud Management Platform.
Talk to your Account Manager to get started, or follow these instructions to set it up and start exploring!
Happy optimizing!